In 2022-01, we published 1 report, 2 automations and 8 examples using crosscompute 0.9.0.
Reports
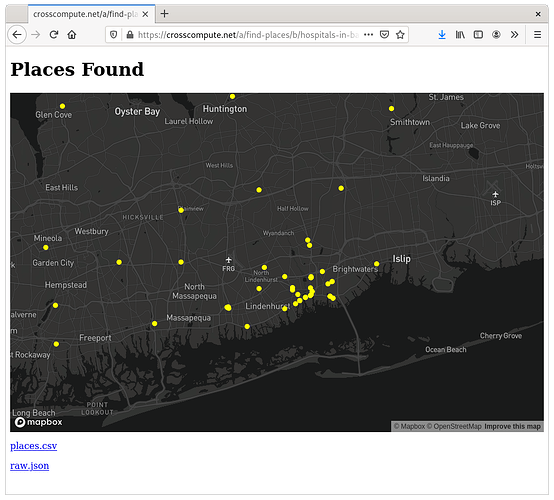
- Locating Hospitals in Mayfield, Kentucky, USA presents the Find Places tool for gathering critical building location data, based on the task of locating medical infrastructure in Mayfield, Kentucky. The town was recently hit by a tornado that caused widespread power outages. Locating buildings is the first step in planning a microgrid that can keep critical buildings operational during an emergency.
Automations
- Find Places is a tool for preparing a critical building dataset for hazard mitigation planning. Enter a description of the building type and a location and the tool will prepare a CSV using the Google Places API.
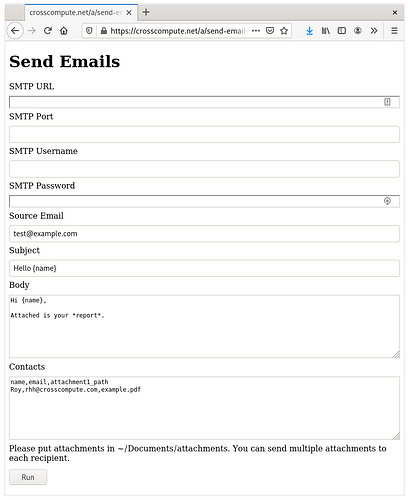
- Send Emails is a tool for automating emails where each recipient receives a different message with attachments, based on a template.
Examples
- Gather Locations is an example of a form for gathering location data. The example configuration demonstrates how to specify input variables for your form. The example script saves geocoded locations to a file and uses
flockto ensure that only one process is accessing the file at any time. - Manage Locations is an example of a widget for mapping location data gathered from the Gather Locations form. The example configuration demonstrates how to map the collected locations using
view: map-deck-screengrid. The example script saves coordinates for each location and computes the map viewport. - Randomize Histograms is an example of a report with static images. The example configuration demonstrates how to use
view: imageto render static images generated by the Jupyter notebook. The example notebook demonstrates how to save output images to the output folder. - Show Maps is an example of a report that shows a GeoJSON polygon on different maps. The example configuration demonstrates how to use
view: map-mapboxto render the polygon with different map styles and fill colors. - Map Schools is an example of a report that maps a dynamic choropleth. The example configuration shows how to use
view: map-deck-screengridto render the dynamic choropleth. The example notebook demonstrates how to prepare the dynamic choropleth coordinate locations from an external spreadsheet. - Ask Question is an example of a tool that generates a markdown output variable. The example configuration shows how to use
view: markdownto render the markdown. The example notebook demonstrates how to save the markdown file in the output folder. - Add Numbers is an example of a tool that takes two numbers as input variables. The example configuration shows how to use
view: numberto render the input variables as number fields. The example script demonstrates how to load variables from the input folder and save variables to the output folder. - Paint Letters is an example of a widget that takes text as an input variable and generates an SVG image output variable. The example configuration shows how to use
view: textto render the input variable as a text field. The example notebook demonstrates how to transform the text into a static choropleth using an SVG template.
Announcements
- crosscompute 0.9.0 is available on PyPI.
- crosscompute 0.9.1 is in development.
- crosscompute-views-map 0.0.1 is available on PyPI.
- crosscompute-views-map 0.0.2 is in development.
- Documentation for the framework is online.


