We are proud to announce the release of CrossCompute Platform 1.9.5.
- Message sales@crosscompute.com if you would like to learn more about deploying the CrossCompute Platform to gather spatial data, analyze data using tools from researchers and automate custom report generation for your organization.
- Message contact@crosscompute.com if you are interested in earning subscription revenue for tools that you have created.

Thank you to Rodrigo Guarachi, Polina Chernomaz, Miguel Ángel Gordián, Marta Moreno, Olga Creutzburg, Samuel Edandison, Roy Hyunjin Han for making this work possible. Click here to see the full list of contributors.
Announcements
- A team from the University of Michigan is conducting a survey on the user experience of our platform. Participants will be able to choose from a selection of rewards.
Uses
Gather Data using Custom Forms
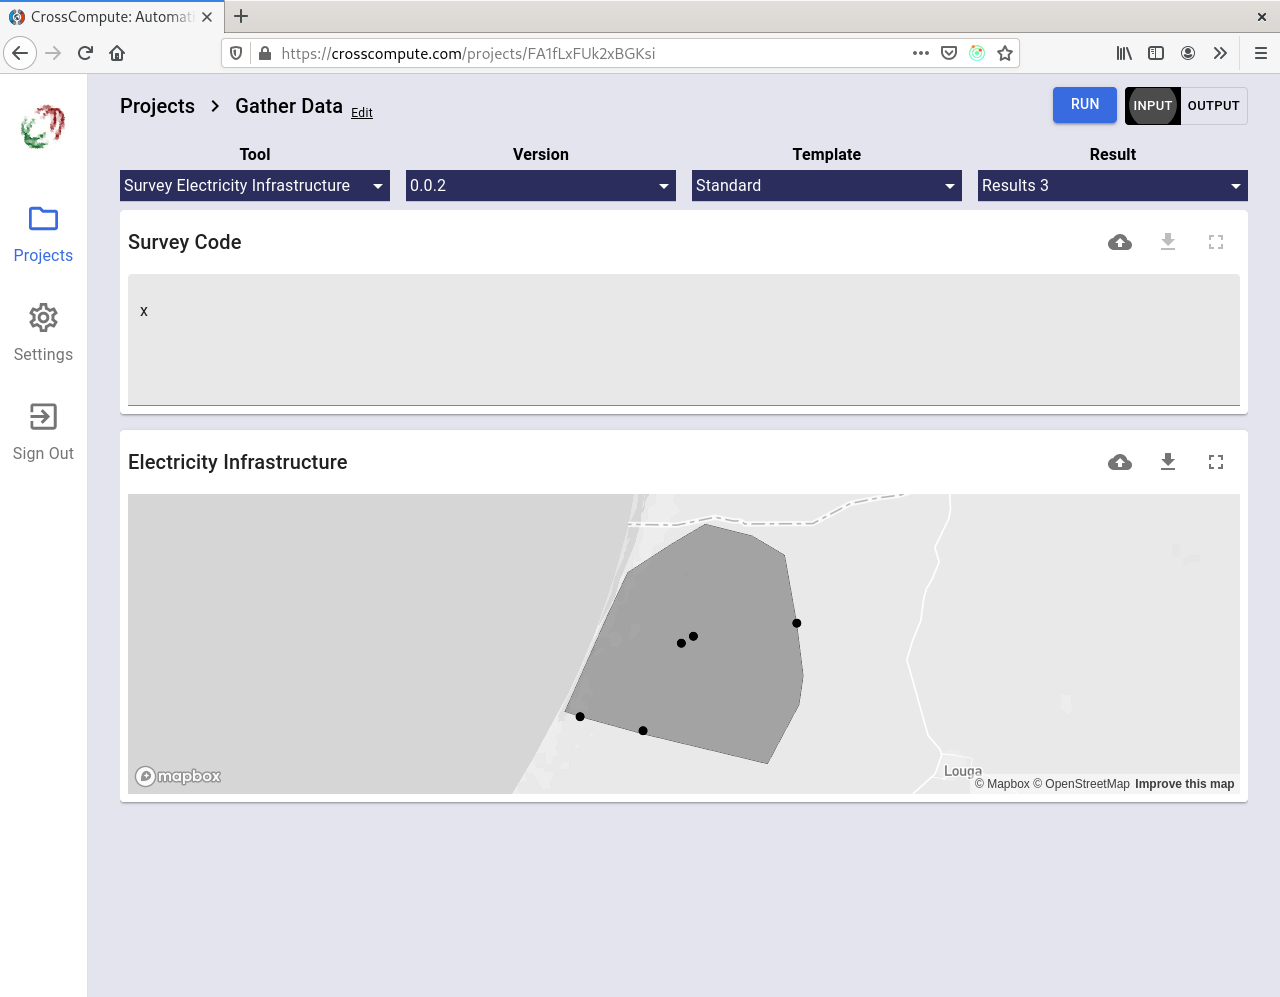
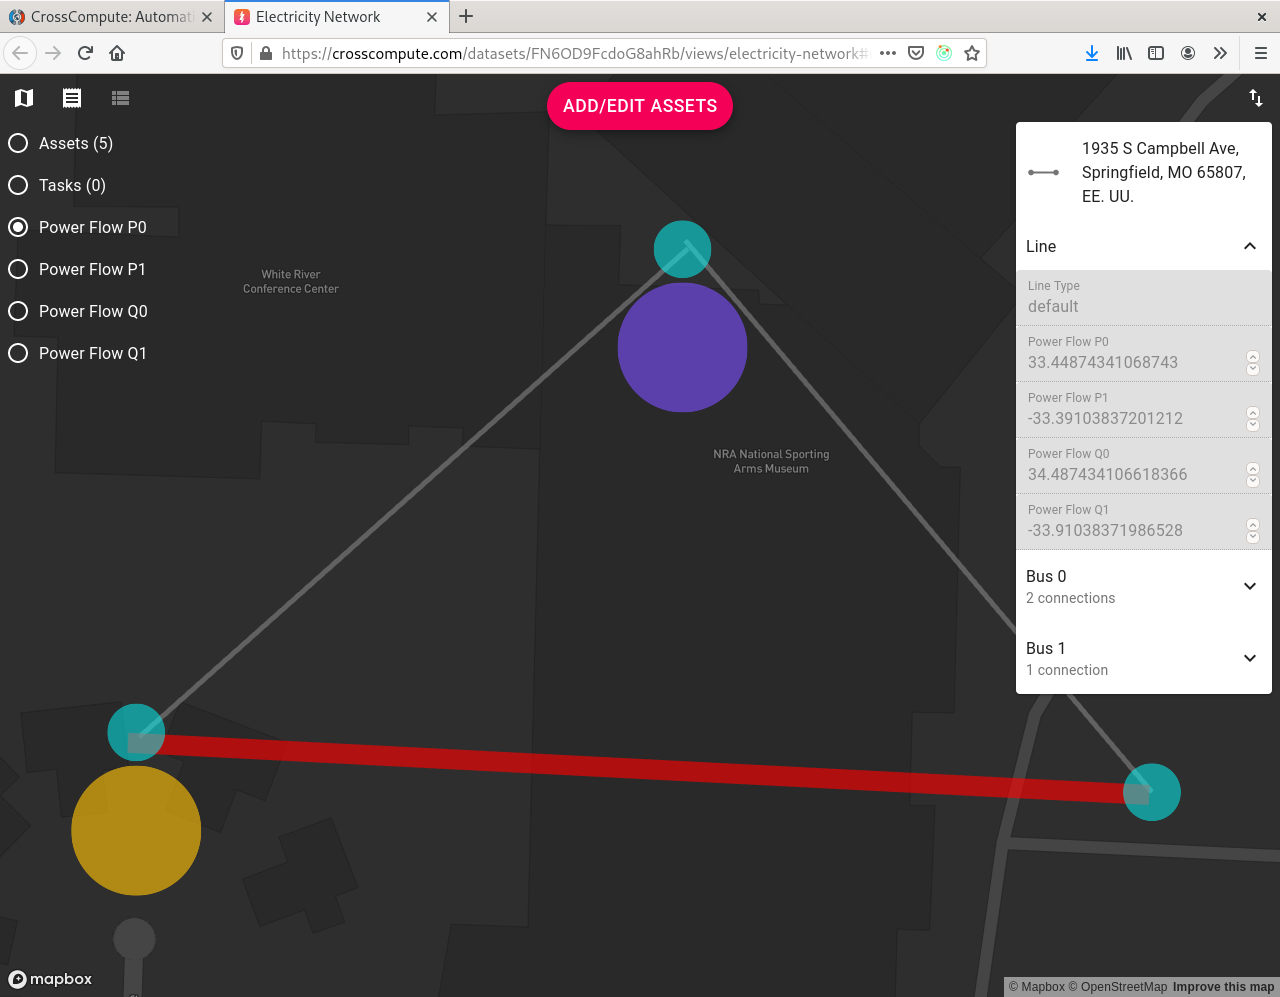
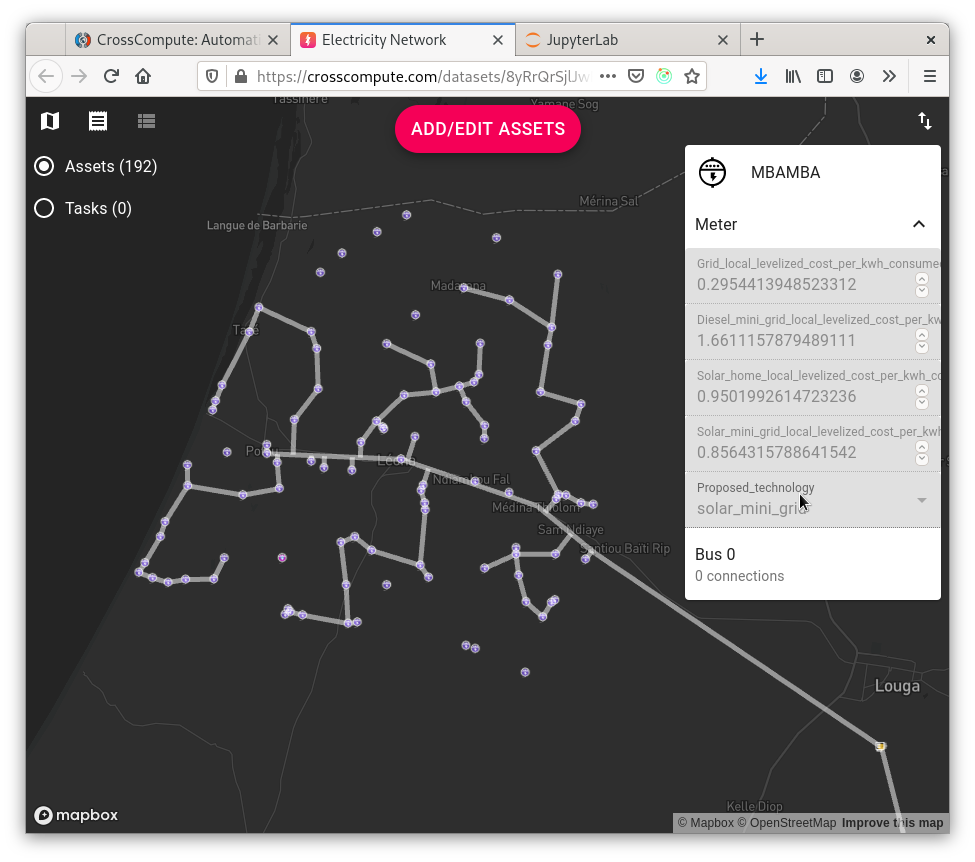
You can now gather electricity infrastructure data using custom forms. Specify view = electricity-network in the input variable definition of your tool configuration file. Here is an example:
Plain spatial vector data is supported as well. Specify view = map in the input variable definition to gather georeferenced points, lines and polygons. Here are the data types that are currently supported:
| Data Type | Variable View |
|---|---|
| text | text |
| number | number |
| markdown | markdown |
| table | table |
| image | image |
| file | file |
| spatial vector | map |
| electricity infrastructure | electricity-network |
You will need to define two tools – one for gathering the data from data collectors and another for aggregating the results into a single dataset. You can write the scripts as JupyterLab notebooks or command line scripts. Here are the steps needed to gather data using a custom form:
- Define and deploy a tool for gathering the data from data collectors. The tool should take the input variables and store them in a folder if you are running the worker manually or in cloud storage. Click here to see an example.
- Define and deploy a tool for aggregating the results into a single dataset (optional). The tool should provide the aggregated dataset as an output variable. Click here to see an example.
- Ask your data collectors to submit results using the data gathering tool that you deployed.
Details for deploying a tool are on PyPI and are summarized in the next section.
Analyze Data using Tools from Researchers
Now that you have your dataset, it is time to analyze it!
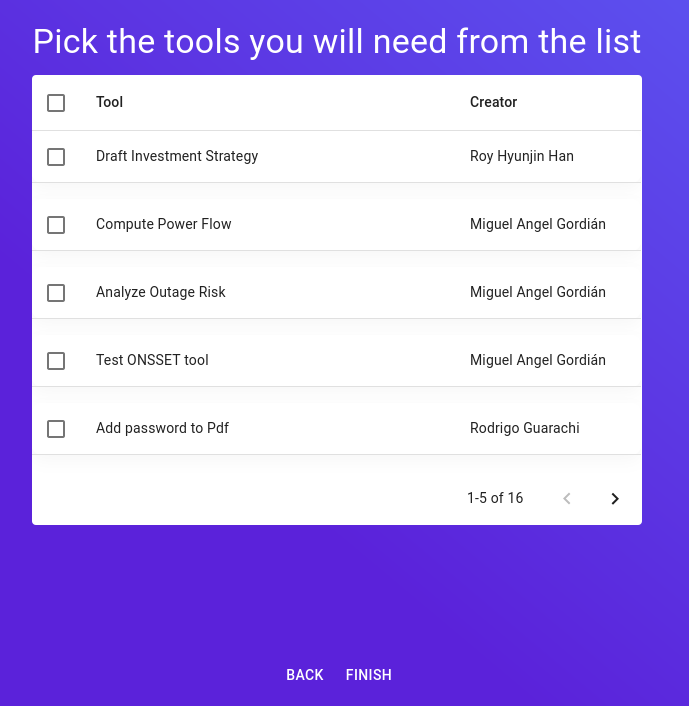
At the moment, we have 16 tools available on the platform from 3 creators.
- Electricity Infrastructure
- Optimize Rural Electrification Technology Choice
- Test ONSSET
- Compute Power Flow
- Analyze Outage Risk
- Survey Electricity Infrastructure
- Collect Electricity Infrastructure Surveys
- Geographic Information System (GIS)
- Generate Random Points within Region
- Generate a Random Contiguous Subset of Features
- Transform Coordinates
- Map Addresses
- Finance
- Draft Investment Strategy
- PDFs
- Extract PDF Pages
- Extract PDF Images
- Add Password to PDF
- Remove PDF Password
- Add Watermark to PDF
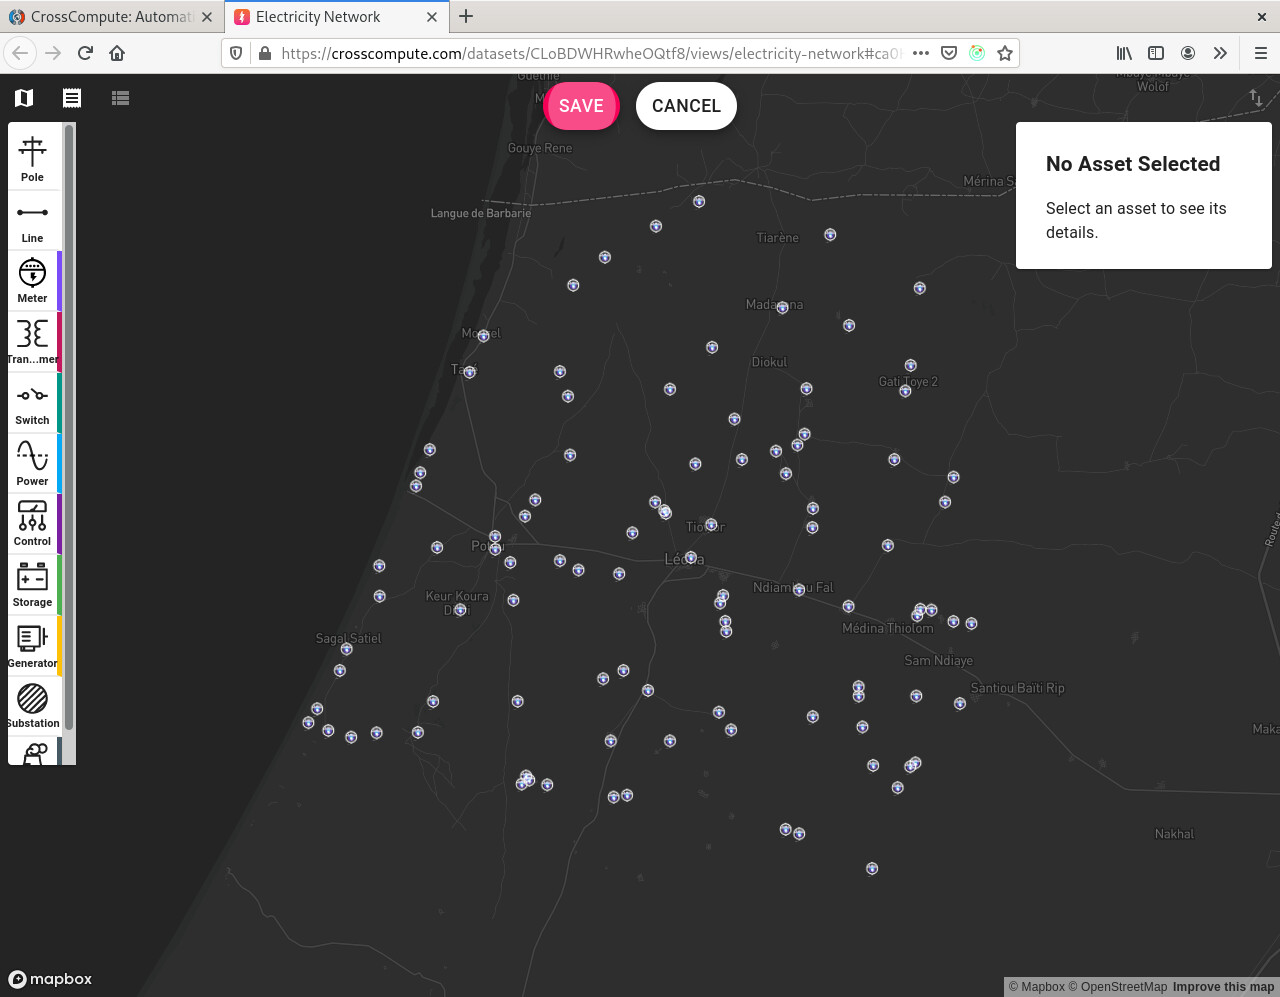
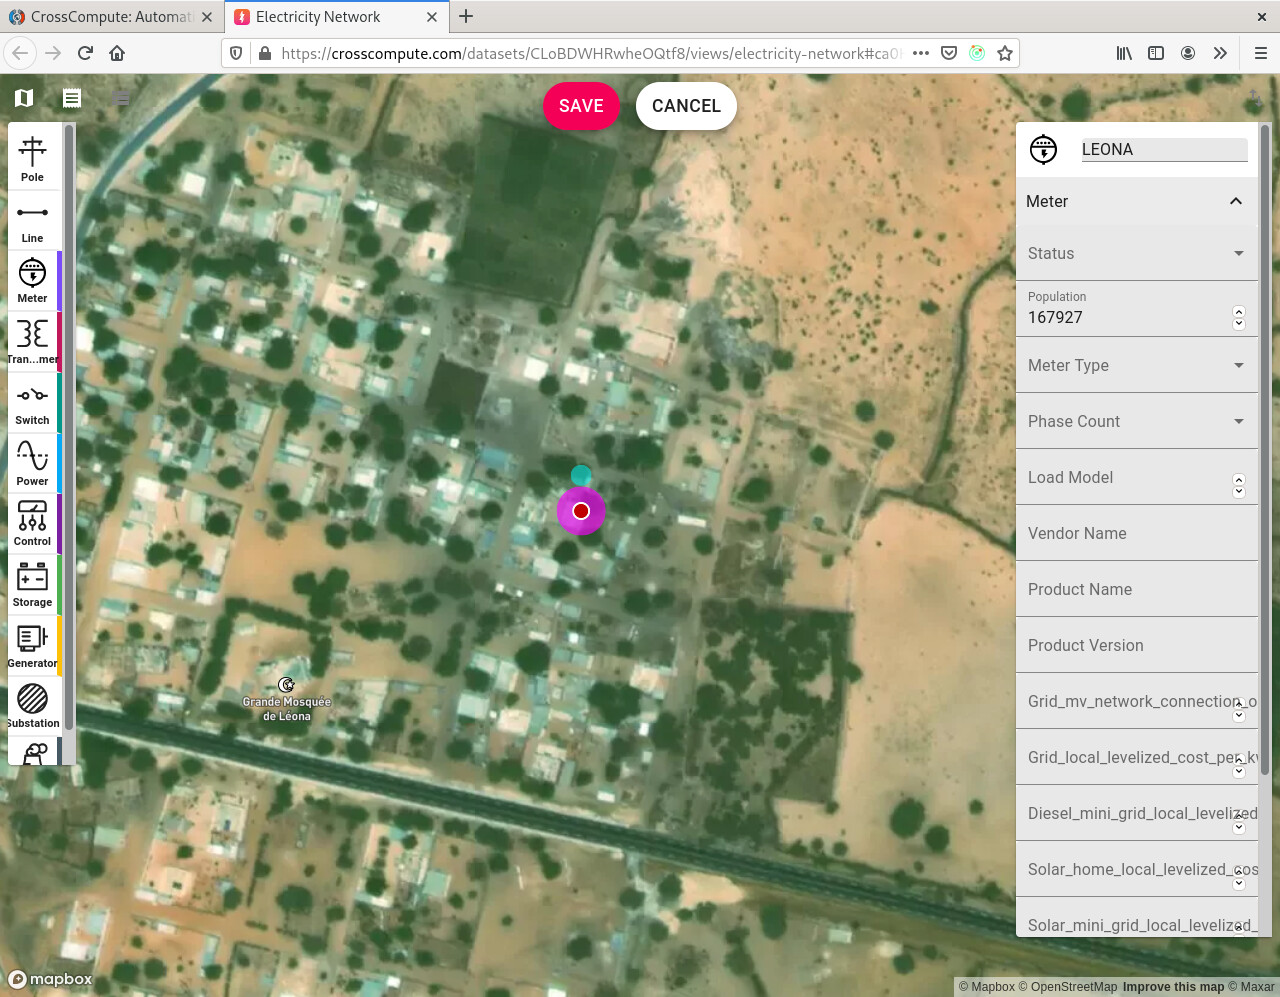
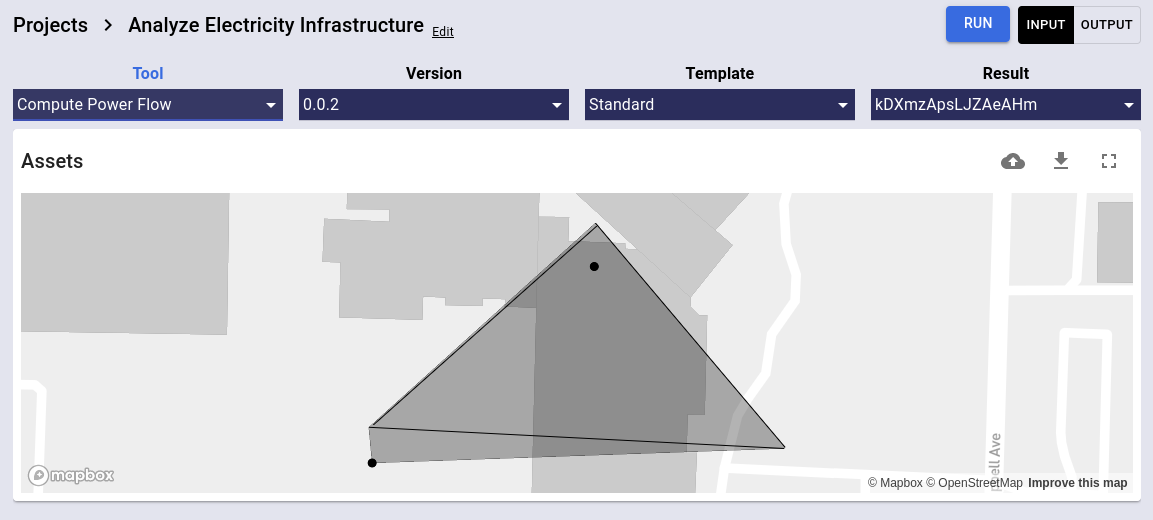
After you have selected the tools you want to use in your project, select the tool you want to use in the upper left dropdown. Each tool has an input page and an output page for viewing input and output variables. For example, to use the Power Flow tool, upload your electricity-network from either Asset Tracker or a tool like NetworkPlanner that generates an electricity-network. You can drag and drop the electricity-network onto the input variable or you can sketch the electricity-network from scratch in fullscreen mode by clicking the fullscreen icon.
You can also deploy your own tools for other people to run to analyze their data. For now, you need to use the command-line interface to deploy your own tools. Here are the steps to deploying your own tool:
Step 1: Install the crosscompute package from PyPI
pip install crosscompute
Step 2: Define your tool configuration file
Here are examples you can use for reference:
https://github.com/crosscompute/crosscompute-examples/blob/master/add-numbers/tool.yml
The main sections of the tool configuration file are where you define the input and output variables. Here are the fields available in an input or output variable:
| Key | Usage | Required |
|---|---|---|
| id | Assigns a variable id that you can reference in your markdown template and determines the key that is used in the dictionary if the view is text or number and the path ends with .json |
Required |
| name | Provides a more descriptive and readable name for the variable | |
| view | Determines the user experience when interacting with this variable and currently must be one of text, number, markdown, table, image, file, map, electricity-network |
|
| path | Sets the path that your script uses to load the input variable from the input folder or save the output variable to the output folder | Required |
Since the exact locations of the input and output folders are determined at runtime, your script needs to get the folder locations dynamically in one of two ways:
- Option 1: From the environment
CROSSCOMPUTE_INPUT_FOLDERCROSSCOMPUTE_OUTPUT_FOLDERCROSSCOMPUTE_LOG_FOLDERCROSSCOMPUTE_DEBUG_FOLDER
- Option 2: Via command line arguments by using placeholders in the
script > commandconfiguration.{input_folder}{output_folder}{log_folder}{debug_folder}
Step 3: Test whether your tool is configured properly
crosscompute tools add . --mock
If there are no errors and all of your tests pass, you are ready to deploy your tool!
Step 4: Deploy your tool
Sign into https://crosscompute.com and paste the commands that are on the Settings page. Then add your tool to the platform.
export CROSSCOMPUTE_SERVER=...
export CROSSCOMPUTE_CLIENT=...
export CROSSCOMPUTE_TOKEN=...

# Option 1: Start a manual worker
crosscompute tools add . --work

# Option 2: Deploy and start the manual worker separately
crosscompute tools add .
export CROSSCOMPUTE_TOKEN=...
crosscompute workers run
For now, all tools require a manual worker in order to run on the platform.
Automate Reports with our JupyterLab Extension
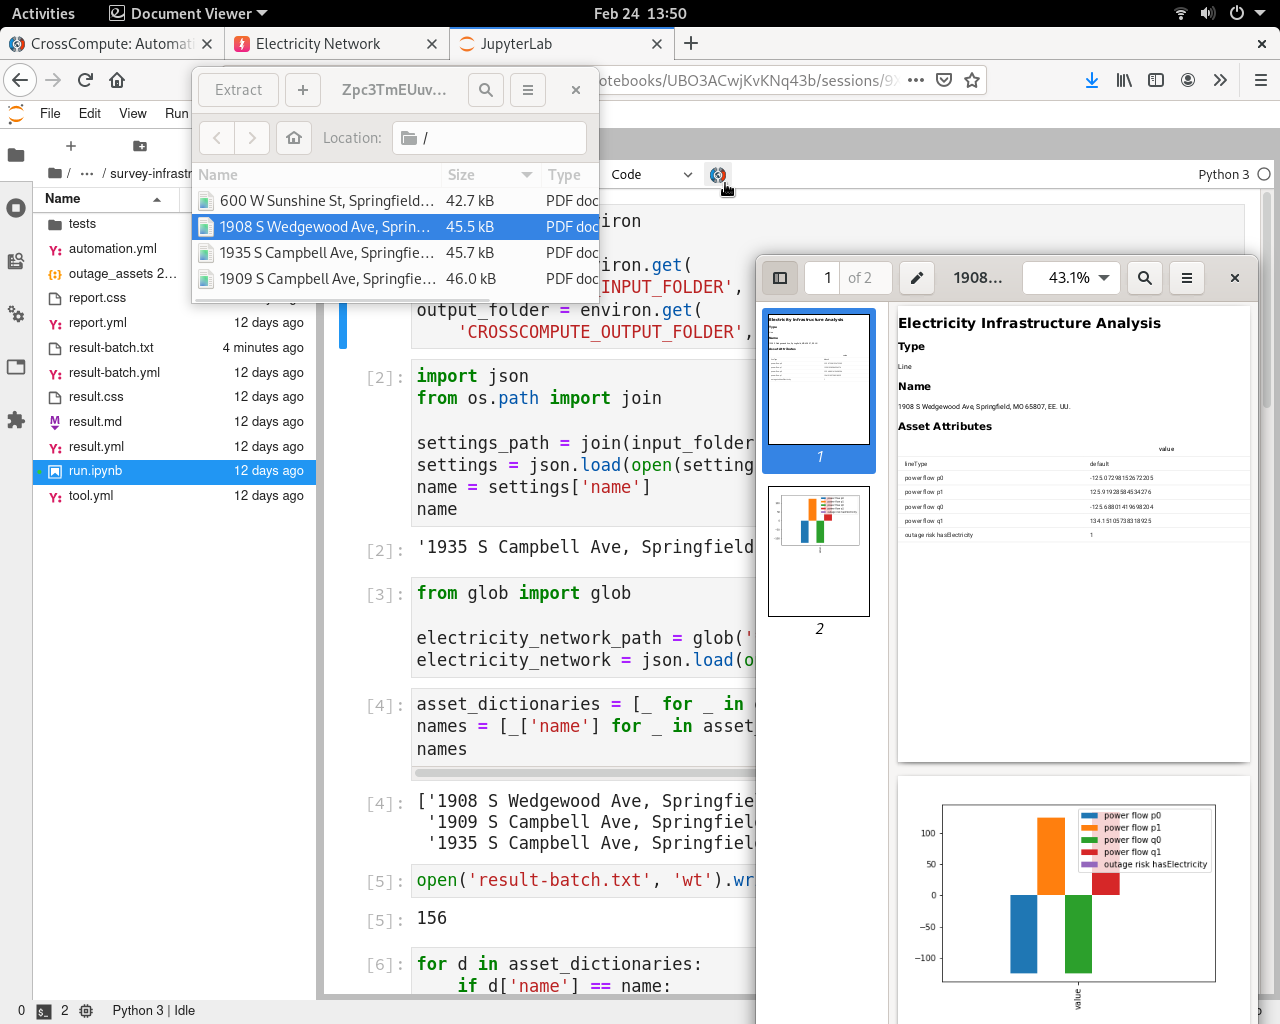
After you have run some analyses, you can combine the datasets and analyses into a custom report using JupyterLab. In addition to the tool configuration file, you will also have to define a result configuration file and an automation configuration file. Click here to see an example automated report configuration.
| Name | Filename | Description |
|---|---|---|
| Tool Configuration | tool.yml | Tells CrossCompute how to run your script |
| Result Configuration | result.yml | Sets input variable data for a specific run of a specific tool |
| Automation Configuration | automation.yml | Defines the behavior when the CrossCompute button is clicked in JupyterLab |
Currently, the extension only supports the auto generation of PDF reports. Please message contact@crosscompute.com if you would like to pilot the report automation extension.
Tools
Electricity Infrastructure
Optimize Rural Electrification Technology Choice
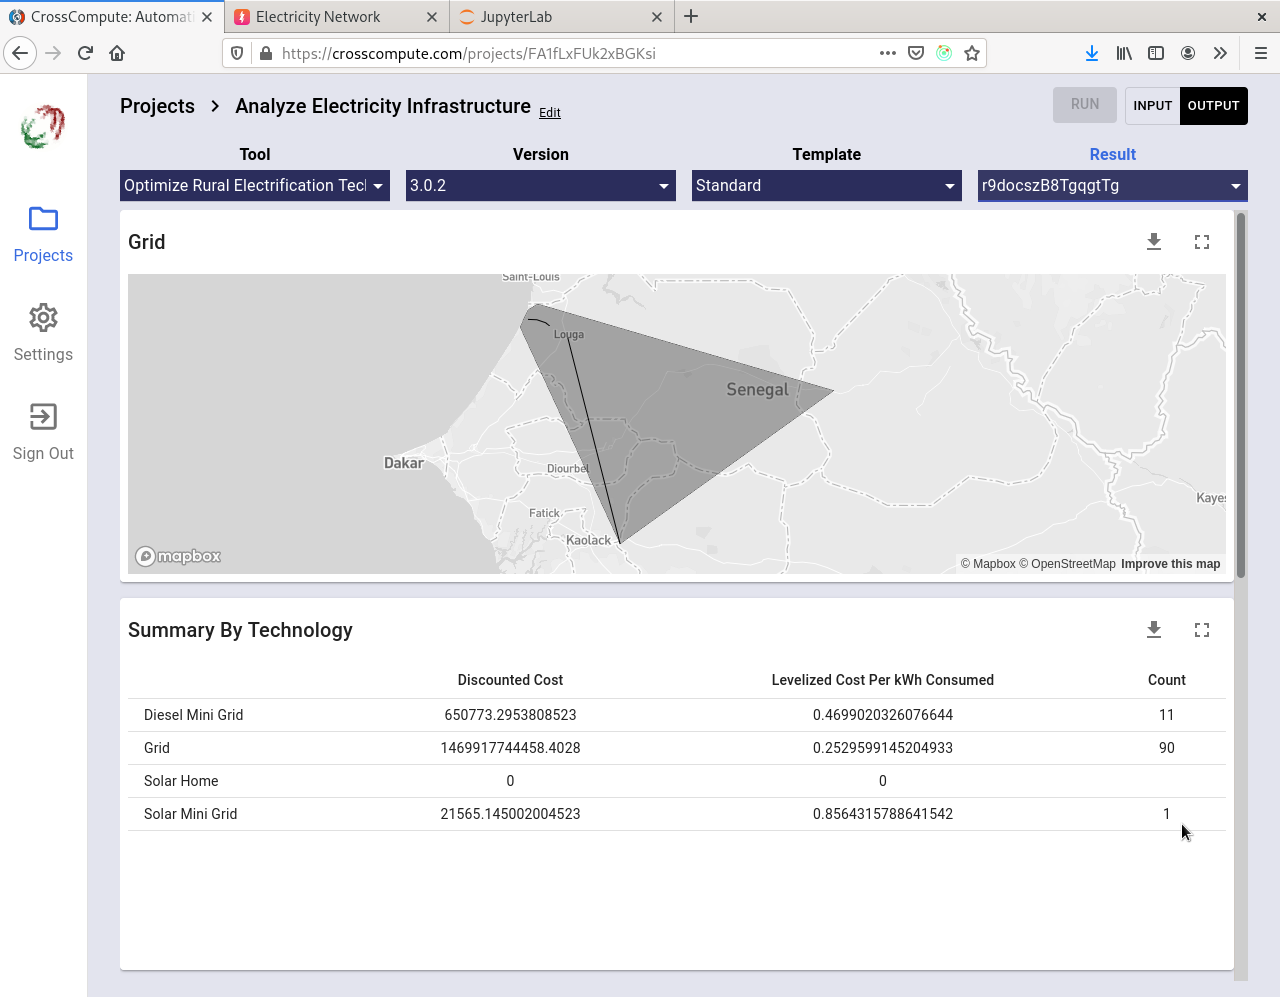
Based on over a decade of work by researchers at the Sustainable Engineering Lab of Columbia University, NetworkPlanner has been used to draft feasibility studies for electrification plans in numerous countries. For this release, the technology choice tool has been upgraded to place power sources (i.e. power plants, substations, generators) and produce an electricity-network that is compatible with downstream tools such as Compute Power Flow and Analyze Outage Risk.
Test ONSSET
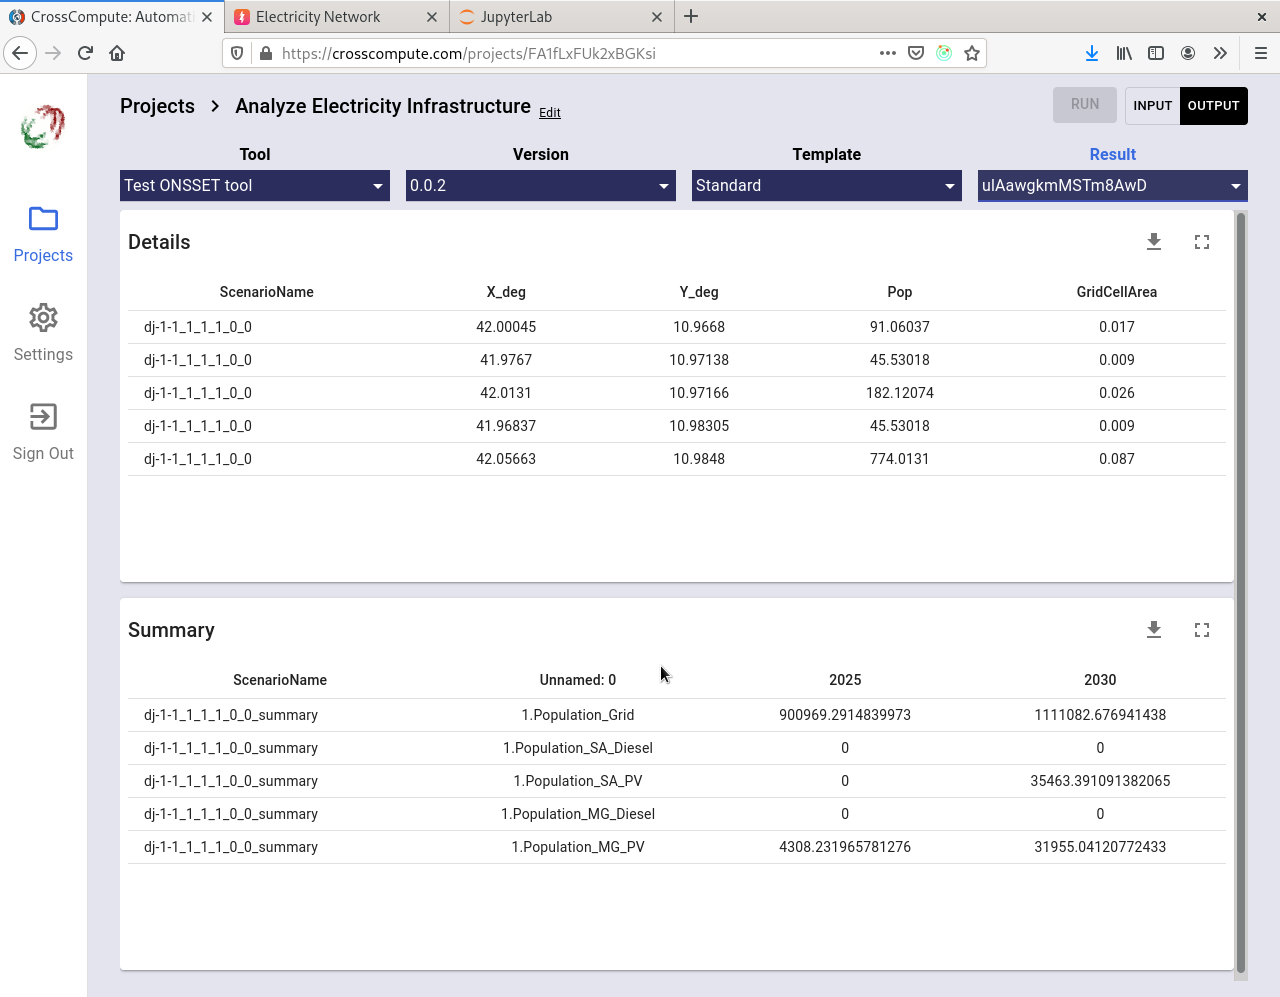
ONSSET is an electrification planning tool developed by the Division of Energy Systems of the KTH Royal Institute of Technology. DevLabs México worked with CrossCompute to port ONSSET onto the CrossCompute Platform. At present, it is possible to run the ONSSET model on the platform, but the tool has not yet been integrated to work seamlessly with the other electrification planning tools.
Compute Power Flow
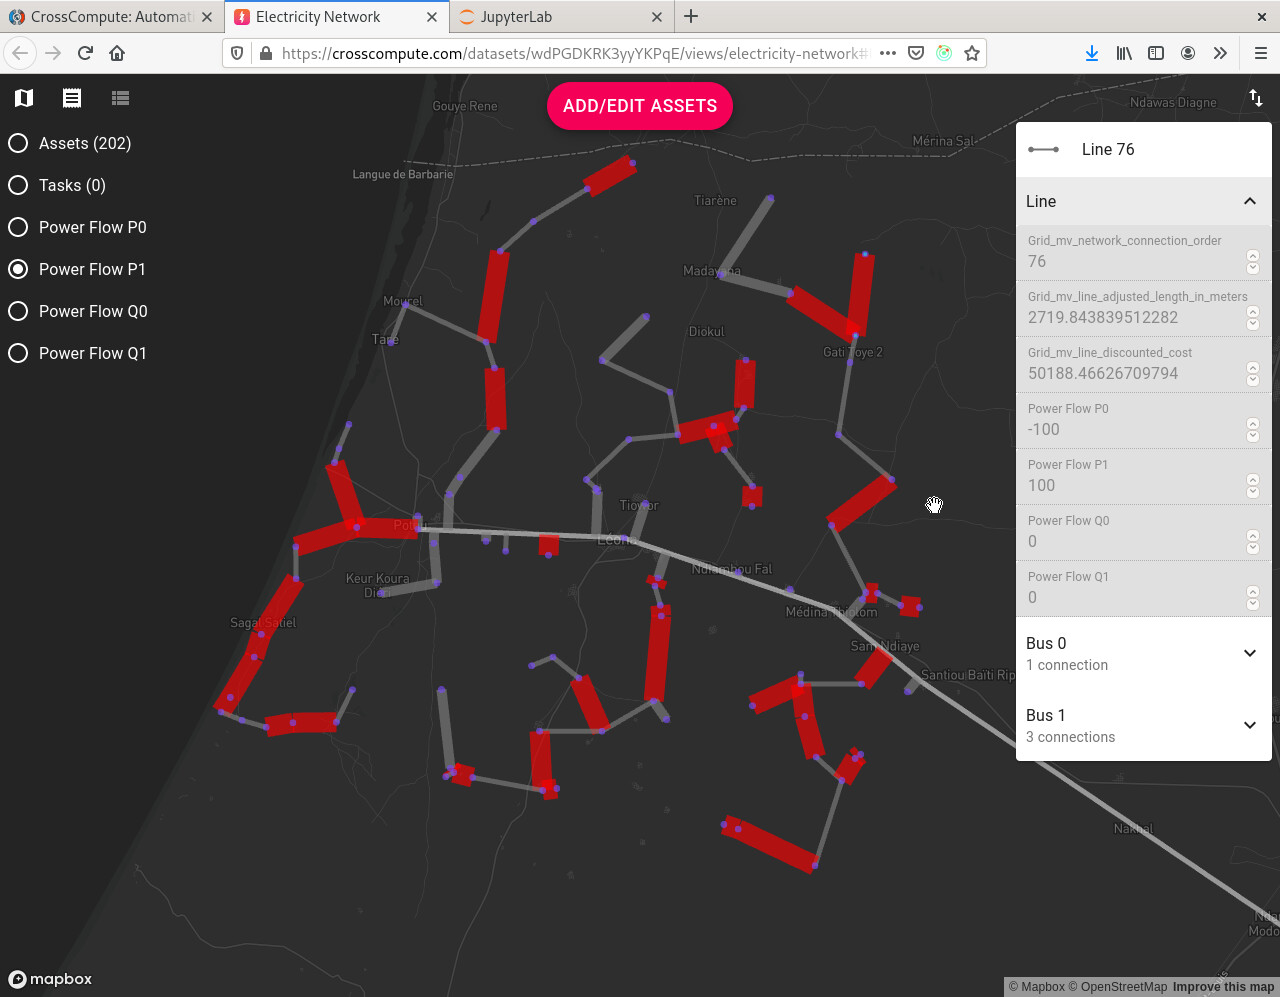
DevLabs México prototyped a power flow analysis tool using the PyPSA package developed by the Energy System Modelling group at the Institute for Automation and Applied Informatics at the Karlsruhe Institute of Technology. The tool takes an electricity-network as input and produces an electricity-network with power flow overlays as output.
- The electricity-network must have a connected generator and connected meters in order to produce a baseline power flow estimate using default voltage values.
- Specify the
baseVoltageof the generator for better results.
Analyze Outage Risk
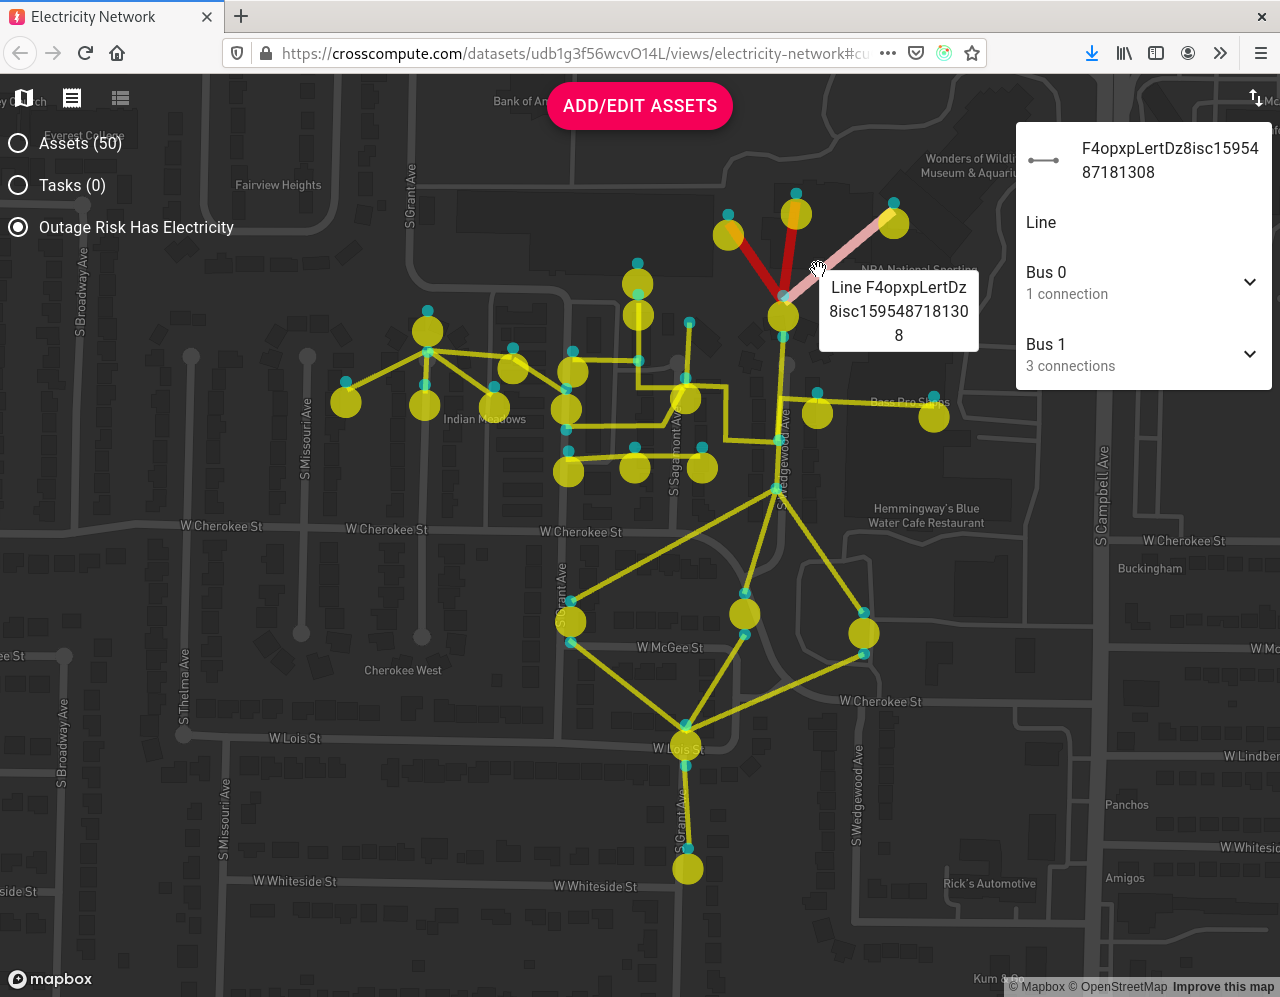
DevLabs México prototyped an outage risk analysis tool using NetworkX and based on an outage risk algorithm developed for Asset Tracker. The tool takes an electricity-network as input and produces an electricity-network with outage risk overlays as output.
- The electricity-network must have a connected generator and connected meters in order to be able to determine the outage risk for each asset.
- Set asset status to
not okto indicate which asset is failing. Running the tool will then compute the assets that are downstream of the failing asset. - Note that only asset types with multiple buses such as transformers, switches and lines have a downstream effect. This means that setting a switch to
not okwill affect downstream assets, but setting a meter tonot okwill not affect downstream assets.
Survey Electricity Infrastructure
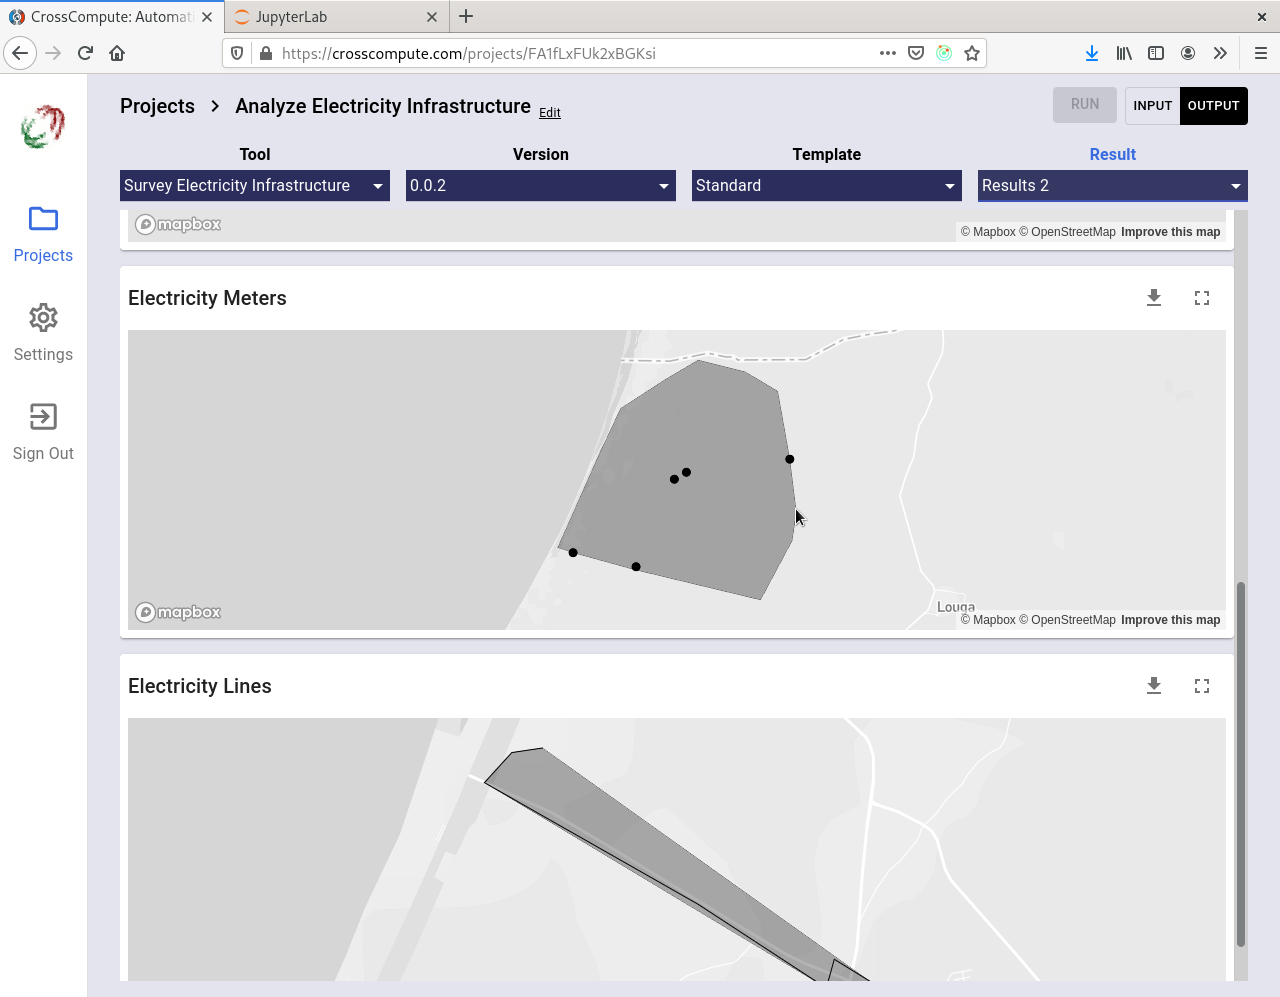
This is an example of a tool for collecting data. Here we demonstrate how to collect electricity infrastructure data by saving each run to a folder. Click here to see the code.
Collect Electricity Infrastructure Surveys
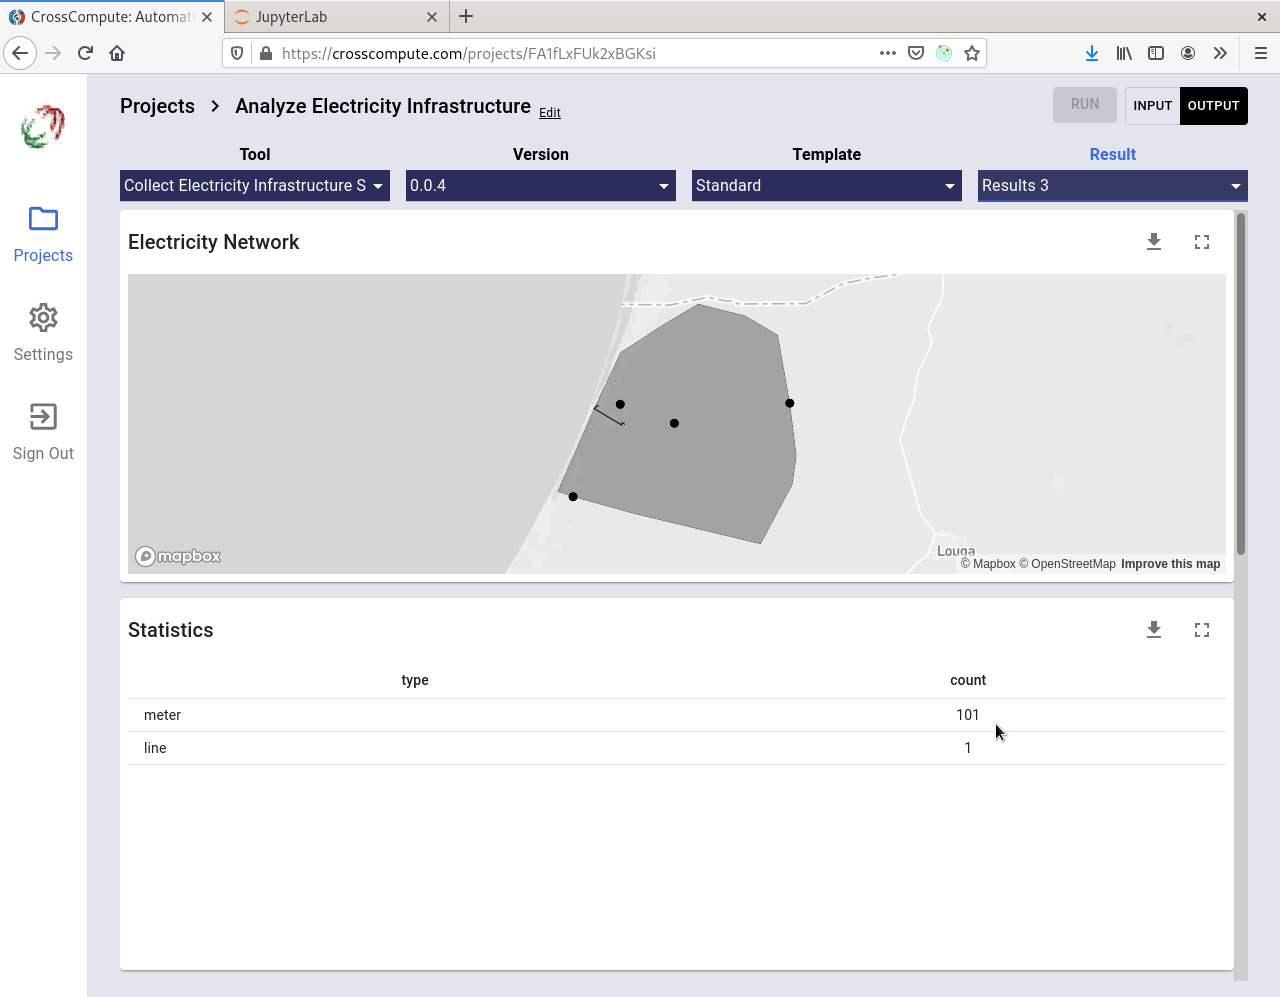
This is an example of a tool for aggregating collected data into a downloadable dataset. Click here to see the code.
Geographic Information System (GIS)
Generate Random Points within Region
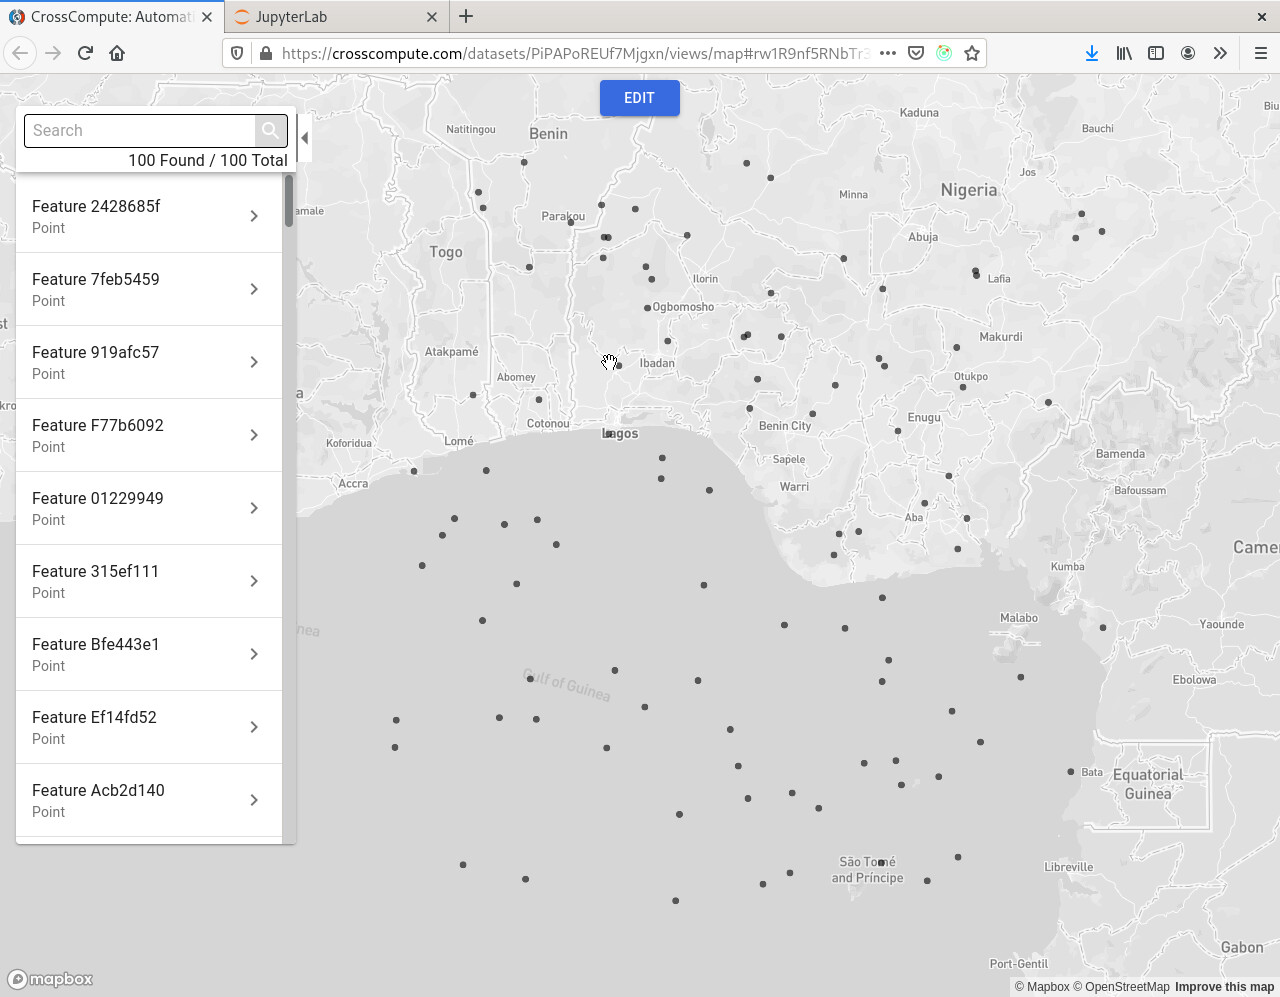
This example tool generates random points within a user-defined polygon.
https://github.com/crosscompute/crosscompute-examples/blob/master/set-points/tool.yml
Generate a Random Contiguous Subset of Features
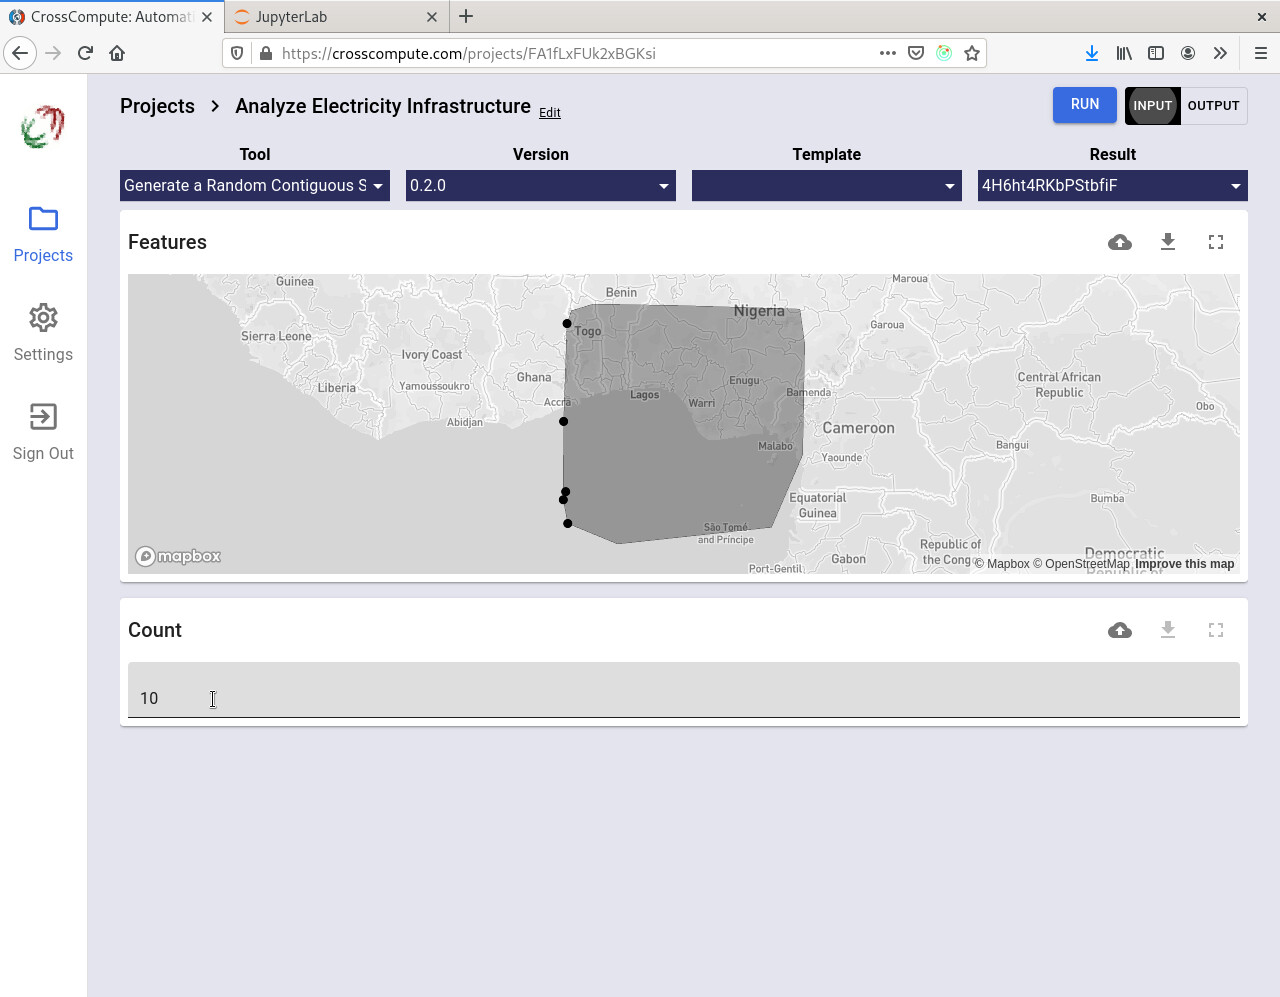
This example tool generates a random contiguous subset from a feature collection, useful for when you want to run your algorithm on a smaller dataset for faster prototyping.
https://github.com/crosscompute/crosscompute-examples/blob/master/subset-features/tool.yml
Transform Coordinates
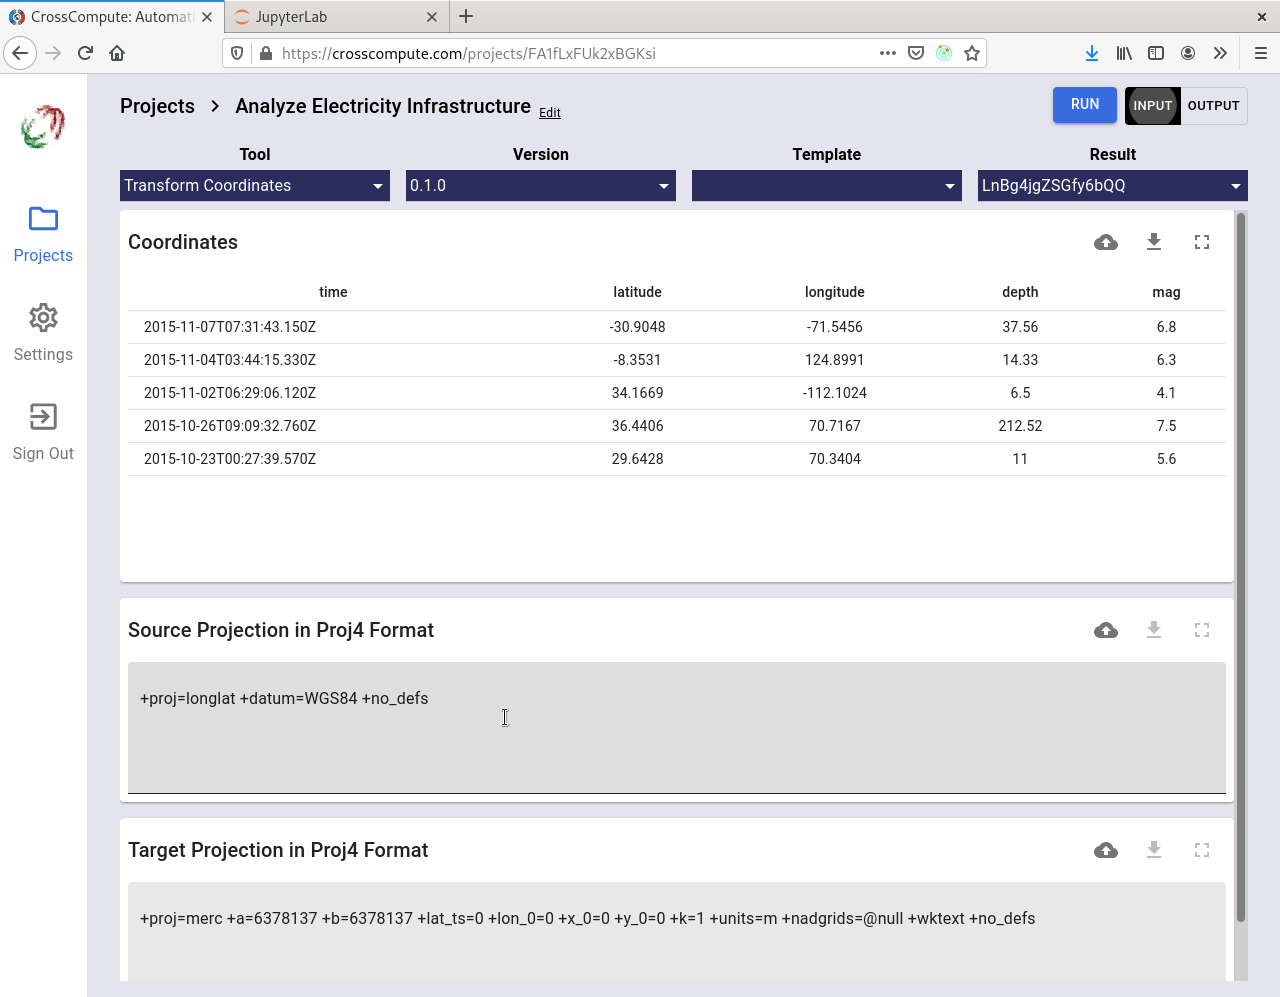
This example tool transforms coordinates in a table into different spatial reference projections.
https://github.com/crosscompute/crosscompute-examples/blob/master/transform-coordinates/tool.yml
Map Addresses
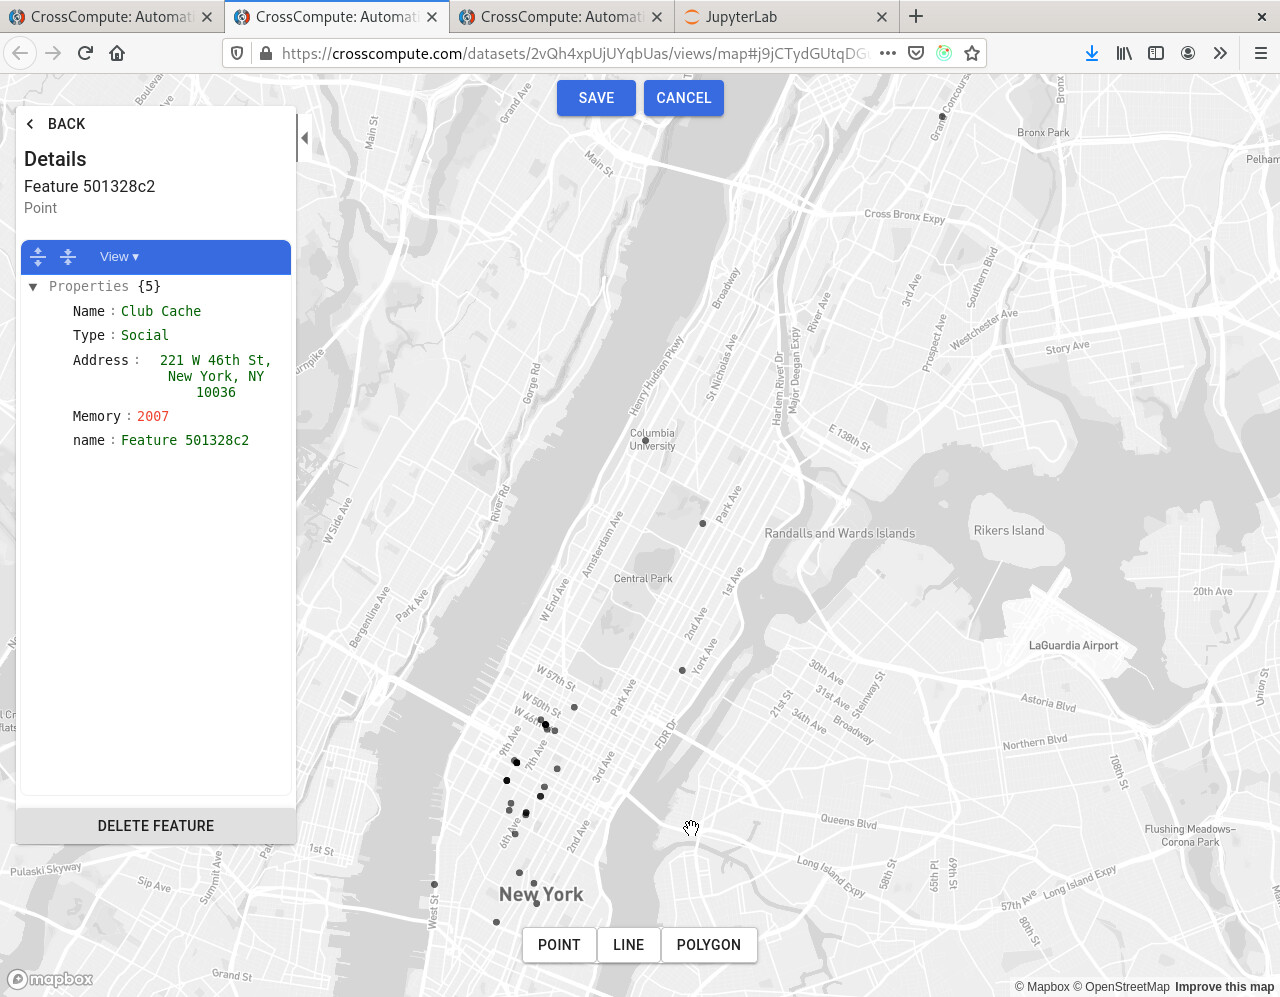
This example tool takes a table of addresses and generates a geojson rendered as a map.
https://github.com/crosscompute/crosscompute-examples/blob/master/map-addresses/tool.yml
Finance
Draft Investment Strategy
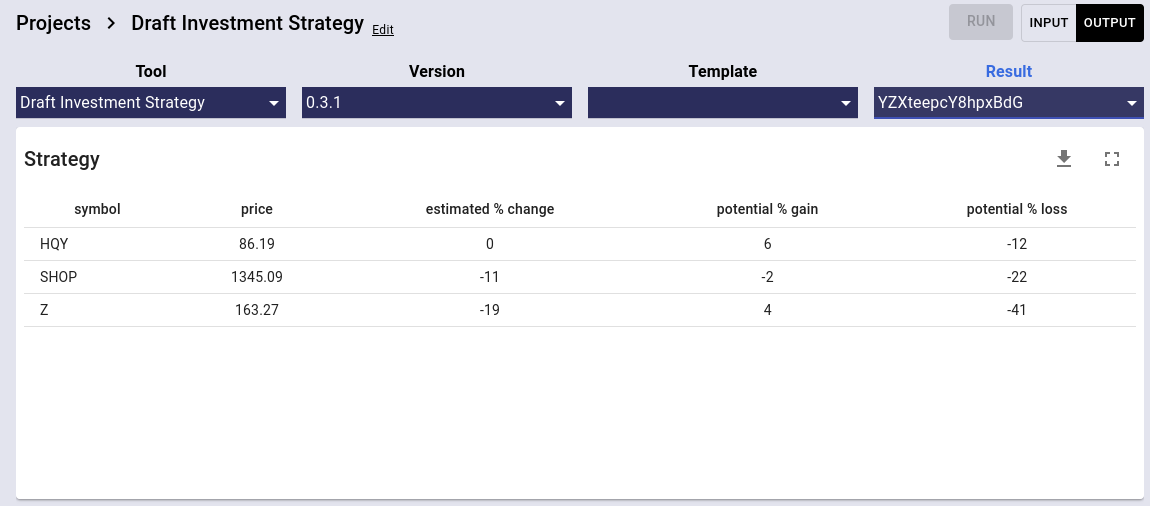
Given a list of ticker symbols, this tool will estimate the percent change in price based on an average of a sampling of options contracts for each ticker.
- symbol = stock ticker
- price = stock price (delayed by up to 24 hours)
- estimated % change = estimated % change based on average price of put and call contracts
- potential % gain = estimated % gain based on average price of call contracts
- potential % loss = estimated % loss based on average price of put contracts
- average price = average price of put and call contracts
- option count = number of put and call contracts
- option std = standard deviation of option prices, used to measure spread
- average max = average price of call contracts
- call count = number of call contracts
- call std = standard deviation of call prices, used to measure spread
- average min = average price of put contracts
- put count = number of put contracts
- put std = standard deviation of put prices, used to measure spread
Here are some other downstream values that are useful to compute:
- put call ratio = put count / call count
- normalized call std = call std / price
Here are some useful filters you can use:
- estimated % change > 20
- option count > 100
- put call ratio < 1
- normalized call std < 1
PDFs
Extract PDF Pages
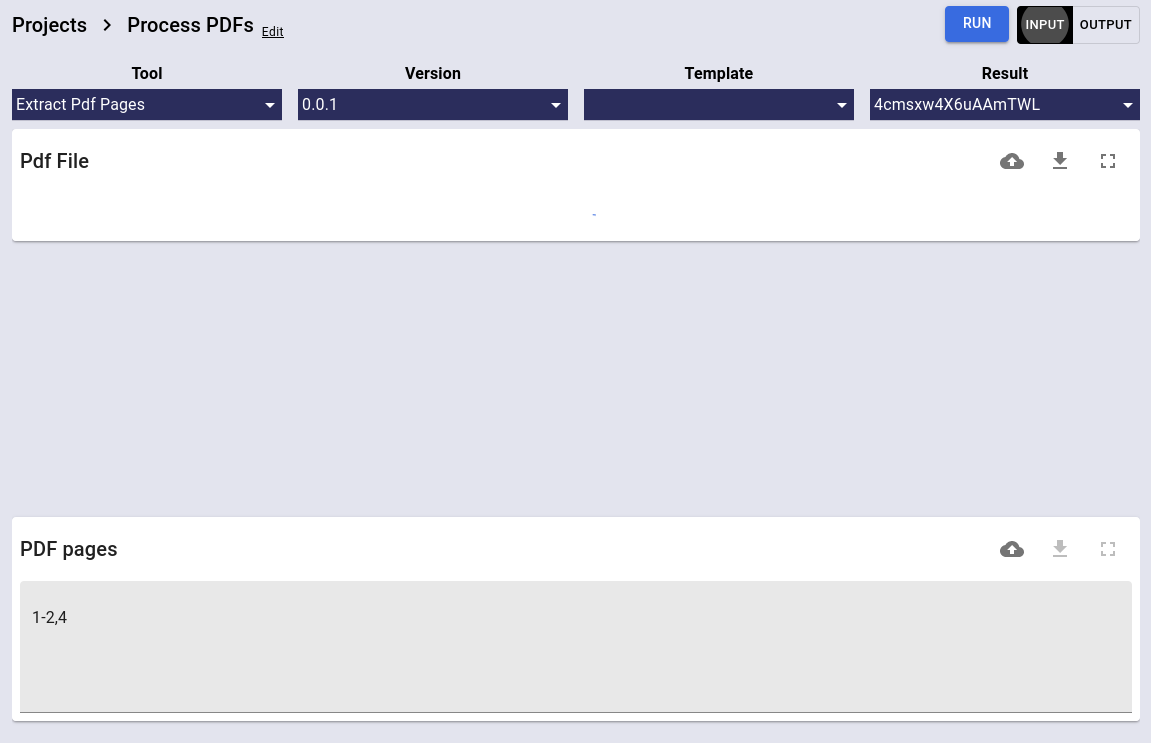
Extract selected pages from a PDF file using this tool by Rodrigo Guarachi.
https://github.com/crosscompute/crosscompute-examples/blob/master/extract-pdf-pages/tool.yml
Extract PDF Images
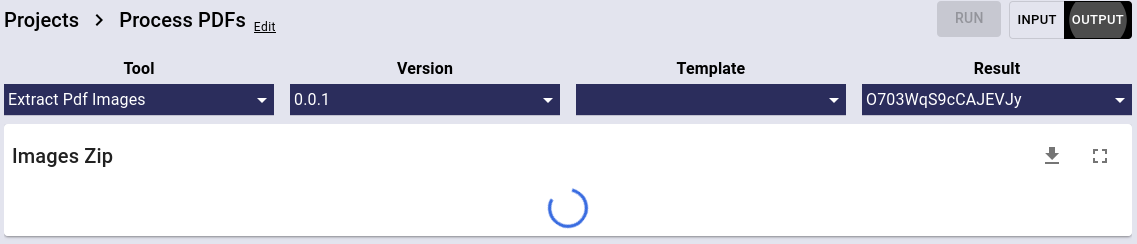
Extract images from a PDF file using this tool by Rodrigo Guarachi.
https://github.com/crosscompute/crosscompute-examples/blob/master/extract-images-pdf/tool.yml
Add Password to PDF
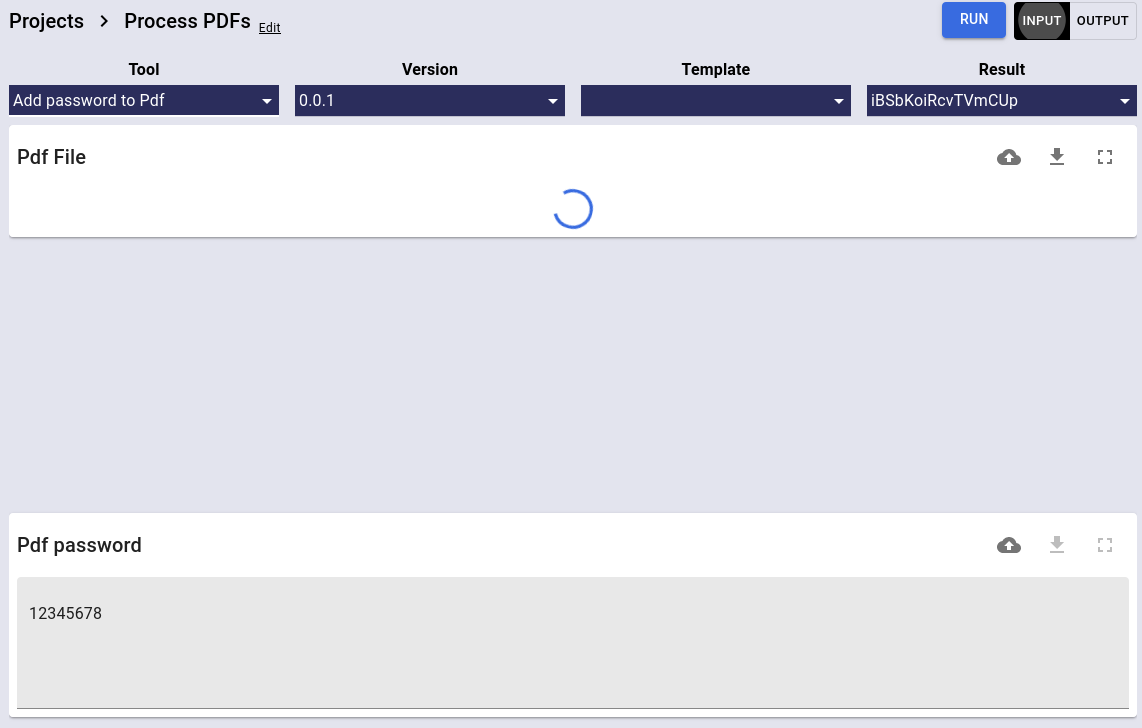
Add password encryption to a PDF file using this tool by Rodrigo Guarachi.
https://github.com/crosscompute/crosscompute-examples/blob/master/encrypt-pdf/tool.yml
Remove PDF Password
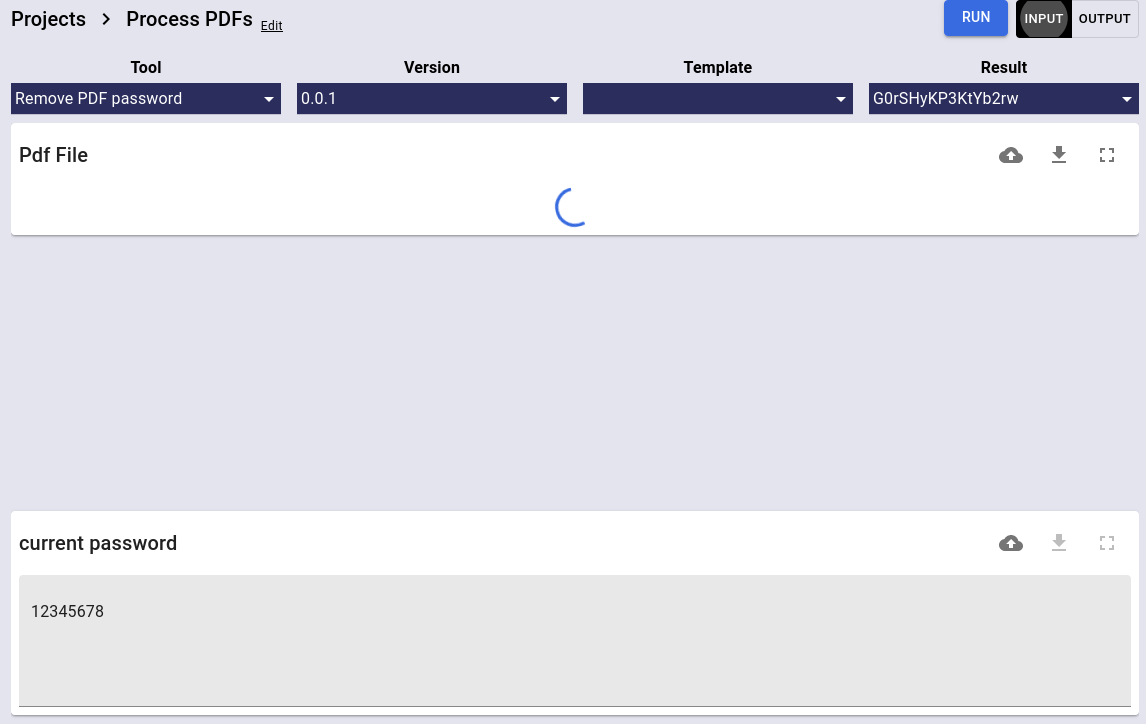
Remove password encryption from a PDF file using this tool by Rodrigo Guarachi.
https://github.com/crosscompute/crosscompute-examples/blob/master/remove-password-pdf/tool.yml
Add Watermark to PDF
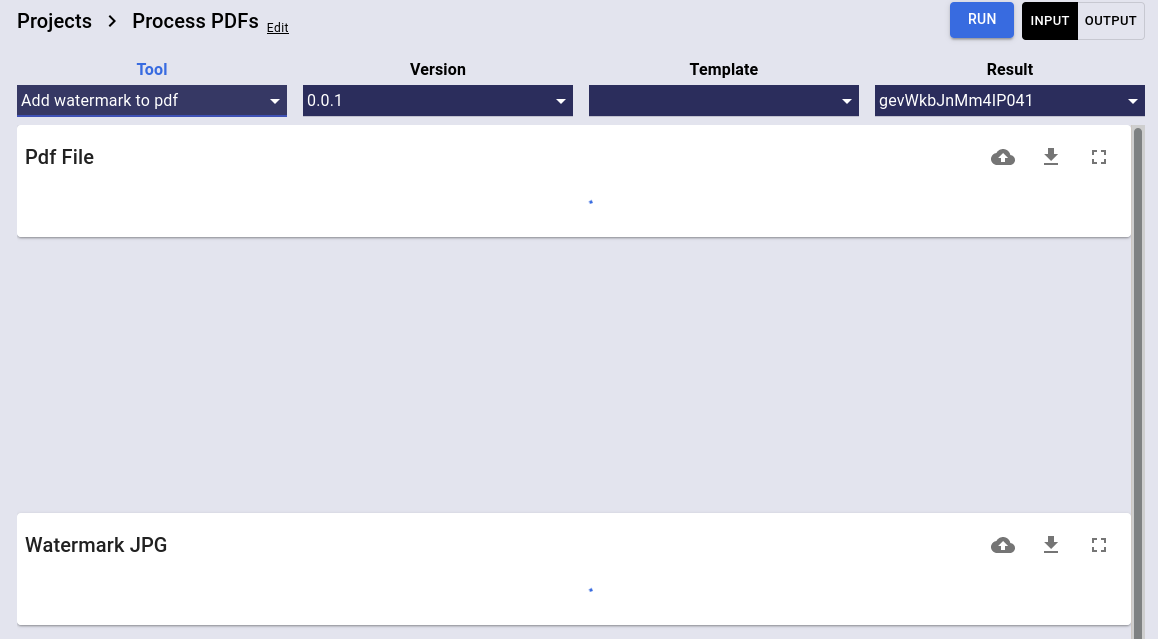
Add a watermark to a PDF file using this tool by Rodrigo Guarachi.
https://github.com/crosscompute/crosscompute-examples/blob/master/add-watermark-pdf/tool.yml
Notes
- CrossCompute Platform 1.9.5 launched on Tuesday, February 9, 2021 with 16 tools from 3 creators.
- The Optimize Rural Electrification Technology Choice tool generates an electricity-network dataset that can then be analyzed with the power flow and outage risk tools.
- Dragging and dropping files onto input variables is now supported.
- Click here to read our 2020 report.