- Use historical data to see where, when and why unplanned outages are happening.
- Define your own hierarchy of causes.
- Use the IEEE-1366-2022 standard for excluding major event days.
- Browse the map on your mobile device in the field, with or without internet.
- Control access to the report using a private platform server with mandatory access control.

The following instructions are for the 20260309 version of the report.
Which circuit had the most unplanned outages per average customer in the past year?

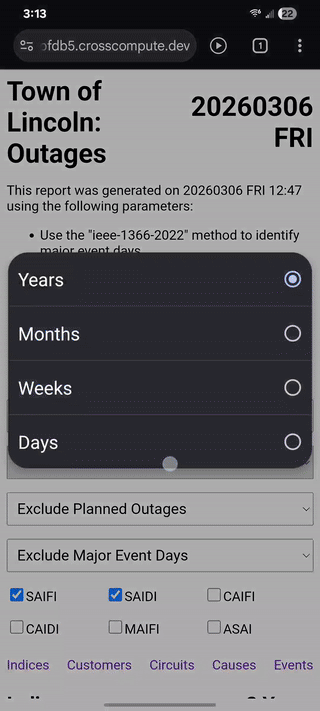
- Select filter: “All Circuits”
- Select filter: “Years”
- Select filter: “Exclude Planned Outages”
- Select filter: “Exclude Major Event Days”
- Select indices: “SAIFI” and “SAIDI”
- Click “Indices” in the navigation bar to scroll to the “Indices” section.
- Click on a line in the “SAIFI” plot to highlight the performance of that circuit; here you can see that circuit “s0-c1” had the worst performance in 2025 with 5.19 sustained interruptions for the average customer.
- Click “Circuits” in the navigation bar to scroll to the “Circuits” section.
- Select period: “1 Year”; here you can see that the circuit “s0-c1” had 450% more sustained interruptions for the average customer in 2025 compared to the prior year.
Where are unplanned outages happening most often?

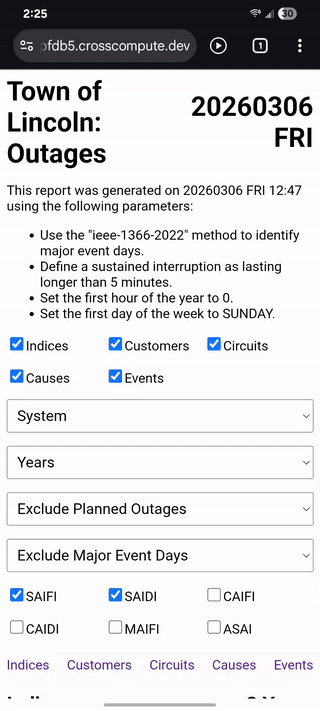
- Select filter: “System”
- Select filter: “Years”
- Select filter: “Exclude Planned Outages”
- Select filter: “Exclude Major Event Days”
- Click “Customers” in the navigation bar to scroll to the “Customers” section.
- Drag one finger to pan the map until the heat map is centered. Red areas indicate a relatively higher number of outages.
- Pinch two fingers to zoom in the map. Notice that the red areas separate.
- Expand two fingers to zoom out the map. Notice that the red areas coalesce.
- Click the “Change” button to open the “Change Map” dialog, select the “Satellite” map style and click the “Close” button.
- Click in the map to see customer details, including recent outages and nearby lines.
What is causing unplanned outages in the worst performing circuit?

- Select filter: “All Circuits”
- Select filter: “Years”
- Select filter: “Exclude Planned Outages”
- Select filter: “Exclude Major Event Days”
- Select indices: “SAIFI” and “SAIDI”
- Click “Circuits” in the navigation bar to scroll to the “Circuits” section.
- Select “1 Year” next to the “Circuits” header to see the worst performing circuits in the past year. For our example, the “s0-c1” circuit performed the worst in 2025.
- Click the SAIDI column header to sort circuits by SAIDI.
- Click the top checkbox in the circuits table to deselect all circuits.
- Click the checkbox next to the circuit with the highest SAIDI.
- Click “Causes” in the navigation bar to scroll to the “Causes” section.
- Drag the slider to adjust the causes depth.
- Type in the search box to highlight specific causes.
Where have customers experienced more than three outages in the past six months?

- Select filter: “All Circuits”
- Select filter: “Months”
- Select filter: “Include Planned Outages”
- Select filter: “Include Major Event Days”
- Click “Customers” in the navigation bar to scroll to the “Customers” section.
- Scroll down to the CEMI plot and click the bar in the plot corresponding to an interruption count of 3+.
- Alternatively, click the “Change” button above the map and set the interruption count to 3+.
Where are the outages that were caused by wildlife and vegetation last year?

- Select filter: “System”
- Select filter: “Years”
- Select filter: “Exclude Planned Outages”
- Select filter: “Exclude Major Event Days”
- Unselect the “Indices” checkbox to hide the “Indices” section.
- Unselect the “Circuits” checkbox to hide the “Circuits” section.
- Click “Customers” in the navigation bar to scroll to the “Customers” section.
- Select period: “1 Year”
- Select an interruption count of 1+, either by clicking on the CEMI plot or in the Change Map dialog.
- Click “Causes” in the navigation bar to scroll to the “Causes” section.
- Click the top checkbox in the causes table to deselect all causes.
- Type “wild” in the search box to highlight the “Wildlife” cause.
- Click the checkbox next to the “Wildlife” cause.
- Type “vege” in the search box to highlight the “Vegetation” cause.
- Click the checkbox next to the “Vegetation” cause.
- Click “Customers” in the navigation bar to scroll to the “Customers” section.
How do the outages caused by wildlife vary seasonally?
- Select filter: “System”
- Select filter: “Months”
- Select filter: “Exclude Planned Outages”
- Select filter: “Exclude Major Event Days”
- Unselect the “Indices” checkbox to hide the “Indices” section.
- Unselect the “Circuits” checkbox to hide the “Circuits” section.
- Click “Causes” in the navigation bar to scroll to the “Causes” section.
- Click the top checkbox in the causes table to deselect all causes.
- Type “wild” in the search box to highlight the “Wildlife” cause.
- Click the checkbox next to the “Wildlife” cause.
- Click “Customers” in the navigation bar to scroll to the “Customers” section.
- Click the Step checkbox and drag the slider to see how the “Wildlife” outages vary by month.
How has reliability changed since three years ago?
- Select filter: “All Circuits”
- Select filter: “Years”
- Select filter: “Exclude Planned Outages”
- Select filter: “Exclude Major Event Days”
- Click “Indices” in the navigation bar to scroll to the “Indices” section.
- Select indices: “SAIFI” and “SAIDI” and “CAIDI”
- Click the Step checkbox and drag the slider to 2023 to see how circuit performance changed since 2023, relative to other circuits.
When were the major event days?

- Select the “Events” checkbox to show the “Events” section.
- Click “Events” in the navigation bar to scroll to the “Events” section.
- Click the Daily SAIDI plot to see SAIDI values for specific days. The major event days are listed below the plot.