UNavMaze Phase 1 Tutorial
Synopsis
Phase 1 of UNavMaze will consist of taking a maze CSV file as an input and then outputing a CSV file containing the maze with a path using the CrossCompute framework.
Table of Contents
Iteration 1: Validity Checks
Goal
Our goal for Iteration 1 is to create some ground rules to identify whether the given CSV file is a maze. We will then output the maze as a txt file if the checks are passed.
The rules for a CSV to be considered a maze are as follows:
- There must be a start and end point (Denoted by S and E respectively).
- There can be no more than one start point.
- There can be no more than one end point.
Configure automate.yml | Reference
The CrossCompute framework will create the interface that the user will use to enter the input data and view the output. To do this, we lay out a set of guidelines (automate.yml) that the framework will follow to identify key parts of our script.
Our automate.yml will consist of the following information:
- Header
- Version of CrossCompute we are using
- Name of our project
- Version of our project
- Input variables
- Output variables
- Batches folder
- Script configuration
Header
Let’s begin with the simple header:
# version of crosscompute
crosscompute: 0.9.4

# name of your automation
name: UNavMaze

# version of your automation
version: 0.0.1
Input
Now we consider what input variable(s) we will use. For this project we will only need to account for one input variable: the CSV containing the maze information. We’ll name the variable data.csv.
# input configuration
input:
  # input variables
  variables:
    - id: data
      view: file
      path: data.csv
id refers to the name that the interface will show for the input
view refers to the type of input that the interface will collect, in our case, we will collect a CSV file as input
path is the location where the input data will be stored
Output
Now that we’ve configured the input variable that will be used, the next step is to identify our output variable(s).
Iteration 1 will be outputting a txt file after the validation checks are passed, so we will only have a single output variable.
# output configuration
output:
  # output variables
  variables:
    - id: mazeFile
      view: link
      path: maze.txt
Our output variable will be a clickable txt file link that the user can download. So we set the view to link, and the path to a txt.
Batches Folder
Now we configure our Batches folder. Our batches folder will be the default dataset that the script runs before the user inputs their data.
# batches configuration
batches:
  - folder: batches/a
Script Configuration
Lastly, we run the script with the names of the variables we will be using in order.
# script configuration
scripts:
  - command: python3 run.py {input_folder} {output_folder}
We are naming our script run.py, our input variable input_folder, and our output variable output_folder.
Create run.py | Reference
We will now create the run.py script. We will be using the following libraries:
# for reading the CSV file
import csv
# for creating the input and output variables
from sys import argv
from os.path import join
We collect our input and output variables as follows:
input_folder, output_folder = argv[1:]
As you may recall, we named our input variable input_folder and output variable output_folder in our automate.yml script.
In order to read in the data the user enters for input_folder, we obtain the file path by joining the input variable with the input path name (data.csv) that we defined in our automate.yml file.
completeName = join(input_folder, "data.csv")
Using the full path, we can now read the csv file that the user inputs with the following line:
with open(completeName, 'r') as file:
Our next steps will are to first convert the CSV file into a 2D list in order to interact with out data easily, then we will validate the information in the list. If it passes our checks, we output a txt with the maze in a more readable format; if it fails, we print the error message and terminate the script.
The following code should help to visualize this:
completeName = join(input_folder, "data.csv")
with open(completeName, 'r') as file:
    data = csvToList(file) # convert our input into a 2D list
    validation = validateMaze(data) # check if the maze is valid
    if validation[0]:
        writeMaze(data) # create txt if valid
    else:
        print(validation[1]) # print error message and terminate
        exit()
In order to convert our CSV to a 2D list, we must first create a list variable with enough size allocated in it to contain the rows and columns in our input data. We do so with the following line:
mazeList = [[0 for i in range(colNum)] for j in range(rowNum)]
Then we iterate through the CSV and place the entries of the CSV input into the corresponding position in the 2D list. Our completed function is as follows:
def csvToList(f):
    """
    Converts CSV file into 2D list format.
    :param f (str): The CSV to be converted.
    :return: 2D list
    """
    with open(f.name, 'r') as file:
        csvData = list(csv.reader(file))
        rowNum = len(csvData)
        colNum = len(csvData[0])
        mazeList = [[0 for i in range(colNum)] for j in range(rowNum)]
        for i in range(rowNum):
            colNum = len(csvData[i])
            for j in range(colNum):
                mazeList[i][j] = csvData[i][j]
    return mazeList
Our next step is to define the validation function. As stated in the Goal section of the tutorial, our maze must contain a start and an end point, and can not contain more than one of each.
We start the function by assuming that the maze is already valid, so we set the variable validation to be True. As we iterate through the data, if we find one of the rules to be broken we set validation to False and we store the error message in String errors. As we find more errors, we concatenate them all in the String errors.
Our validation status (True/False) will be stored in the first return value. All of our error messages will be stored in the second return value.
The completed function is as follows:
def validateMaze(mazeList):
    """
    Validates if a 2D list is a maze by checking if the following rules are passed:
    - There must be a start and end point.
    - There can be no more than one start point.
    - There can be no more than one end point.
    :param mazeList: The 2D list to be validated.
    :return: validation (bool), errors (str)
    """
    validation = True
    errors = ""
    startCount = 0
    endCount = 0
    for i in range(len(mazeList)):
        for j in range(len(mazeList[0])):
            if mazeList[i][j] == "S":
                startCount += 1
            elif mazeList[i][j] == "E":
                endCount += 1
    if startCount == 0 or endCount == 0:
        validation = False
        errors += "There must be a start and end point.\n"
    if startCount > 1:
        validation = False
        errors += "There can be no more than one start point.\n"
    if endCount > 1:
        validation = False
        errors += "There can be no more than one end point.\n"
    return validation, errors
The final step is to output the information to a txt file if validation has passed.
We can get the full path name of our output folder with the following line:
completeName = join(output_folder, "maze.txt")
We are joining our output_folder variable with the output path name (maze.txt) we defined in automate.yml to get the path name.
Now we iterate through the 2D list in order to input the information to a txt into a more readable format.
In order to make it readable, we employ the following rules:
- For every entry except the first entry, add a space.
- If the entry is a blank cell, put a space in its place.
The completed code is as follows:
def writeMaze(mazeList):
    """
    Write out a 2D list in the format in a txt file.
    :param fileName: The name of the file.
    """
    completeName = join(output_folder, "maze.txt")
    mazeFile = open(completeName,"a")
    for i in range(len(mazeList)):
        row = ""
        for j in range(len(mazeList[0])):
            if row != "": # If we are not at the beginning of a row, add a space before we add the next entry
                row += " "
            if mazeList[i][j] == "": # If the entry is a blank cell, put a space in its place.
                row += " "
            else:
                row += str(mazeList[i][j]) # Enter the entry in the cell
        mazeFile.write(row + "\n") # Write the row to the txt and proceed to next row.
Running the crosscompute command will now generate an interface that takes a CSV maze as input, validates it, and outputs a txt if it is a valid maze.
Iteration 2
Goal
For Iteration 2 of our project, we will take a validated 2D list and create a weighted NetworkX graph from it. We will display the graph as an image using the CrossCompute framework.
Configure automate.yml | Reference
Edit Output Variable
We edit the output variable so we can output an image in the interface that CrossCompute creates:
# output configuration
output:
  variables:
    - id: mazeFile
      view: image
      path: mazeGraph.png
Adding an Environment
We’re now adding libraries that need to be downloaded, so the automate.yml file must be configured to ensure that the libraries are automatically downloaded upon running the crosscompute command.
We add the following lines at the bottom of our automate.yml to ensure the files are downloaded:
environment:
  packages:
    - id: networkx[default]
      manager: pip
    - id: matplotlib==3.7.2
      manager: pip
We download the NetworkX library to create the graph, and Matplotlib in order to display it.
Configure run.py: Adding the listToNetworkXGraph function | Reference
We will add a new function to the script to convert a validated 2D maze into a weighted NetworkX graph.
First we define a graph G to be a NetworkX directed multigraph.
def listToNetworkXGraph:
    G = nx.MultiDiGraph()
Now we iterate through our 2D maze to fill in the graph with corresponding information.
As we iterate through our list, we will create nodes which have an id that corresponds to its position on the list:
for row in range(len(mazeList)):
    for col in range(len(mazeList[0])):
      G.add_node((row,col))
We will set the weight of the edges that connect the nodes as follows:
- walls will be set to weight 999999
- cells with an integer weight will be set to that weight in the graph (a cell of 3 would be weighed as 3 in the graph).
- blank cells would be weighed as the default weight (1).
def addWeightedEdges(G, mazeList, currentEntry, nextEntry):
    nextEntryValue = mazeList[nextEntry[0]][nextEntry[1]]
    if nextEntryValue == "W":
        G.add_weighted_edges_from([(currentEntry,nextEntry,999999)],weight="weight")
    elif nextEntryValue.isnumeric():
        G.add_weighted_edges_from([(currentEntry,nextEntry,int(nextEntryValue))],weight="weight")
    else:
        G.add_weighted_edges_from([(currentEntry,nextEntry,1)],weight="weight")
Now we connect it to our listToNetworkXGraph function:
def listToNetworkXGraph:
    G = nx.MultiDiGraph()
        for row in range(len(mazeList)):
            for col in range(len(mazeList[0])):
                G.add_node((row,col))
                if row != 0: # If we are not in the first row, then we can connect edge to top of current row
                    addWeightedEdges(G, mazeList, (row,col), (row-1,col))
                if col != 0: # If we are not in the first col, then we can connect edge to left of current col
                    addWeightedEdges(G, mazeList, (row,col), (row,col-1))
                if row != len(mazeList)-1: # If we are not in the last row, then we can connect edge to bottom of current row
                    addWeightedEdges(G, mazeList, (row,col), (row+1,col))
                if col != len(mazeList[0])-1: # If we are not in the last col, then we can connect edge to right of current col
                    addWeightedEdges(G, mazeList, (row,col), (row,col+1))
We can output the weights as an edgelist to ensure that all of the weights are correctly inputted.
nx.write_weighted_edgelist(G, "weighted.edgelist")
We will now colorcode and label the graph before displaying it by using a colorMap that corresponds to each entry’s position.
Walls will be colored black, the start will be colored green, the end will be colored red, any weighted cell will be colored brown, and empty cells will be colored white.
colorMap = []
labels = dict()
pos = dict()
count = 0
for i in range(len(mazeList)):
    for j in range(len(mazeList[0])):
        pos[i,j] = j,len(mazeList)-i
        labels[i,j] = mazeList[i][j]
        if mazeList[i][j] == "W":
            colorMap.append("black")
        elif mazeList[i][j] == "S":
            colorMap.append("green")
        elif mazeList[i][j] == "E":
            colorMap.append("red")
        elif mazeList[i][j].isnumeric():
            colorMap.append("brown")
        else:
            colorMap.append("white")
We draw and save the graph using the following commands:
nx.draw_networkx(G,pos, node_color=colorMap, labels=labels, font_size=6)
plt.axis("off")
completeName = join(output_folder, "mazeGraph.png")
plt.savefig(completeName, format="PNG")
Lastly, we edit the end of our run.py to call the new function instead of writing to a txt:
completeName = join(input_folder, "data.csv")
with open(completeName, 'r') as file:
    data = csvToList(file)
    validation = validateMaze(data)
    if validation[0]:
      # writeMaze(data) # <- Deleted part
        listToNetworkXGraph(data, display=True) # <- Added part
    else:
        print(validation[1])
        exit()
Upon running the crosscompute command and supplying an input, we recieve an image of a weighted NetworkX graph as an output.
Iteration 3
Goal
For Iteration 3, we use NetworkX to find an optimal path using the A* algorithm. We will then display the outputted path as a CSV by concatenating the solution cells with a P.
Configure run.py: Exporting Completed Path as CSV | Reference
In order to find an optimal path using NetworkX, we first must identify the start and end points and note their position. So we create a function for locating the start and end points from a 2D list.
def locateStartAndEnd(mazeList):
    startPoint = (0,0)
    endPoint = (0,0)
    for i in range(len(mazeList)): # iterate through rows
        for j in range(len(mazeList[0])): # iterate through each col
            if mazeList[i][j] == "S":
                startPoint = i,j
            elif mazeList[i][j] == "E":
                endPoint = i,j
    return startPoint, endPoint
Using their positions, we compute the shortest path using the following command:
def calculatePath(G, startPoint, endPoint):
    return nx.astar_path(G, startPoint, endPoint)
We recieve a list of tuples containing positional value for the path from this command. We write the information to our 2D list so that we can write the entire maze from the list to a CSV.
def mazeSolution(data, path):
    """
    Given a path, input the solution into a given list.
    :param data (list): The list being referenced.
    :param path (list): The path that will be added to the list.
    """
    for i in range(1,len(path)-1):
        data[path[i][0]][path[i][1]] += "P" # We concatenate the P in front of any weighted cells, if any.
Now we read the 2D list into a CSV:
def exportCSV(data, folder, name):
    """
    Export a csv file given data for contents of the maze
    :param data (list): The list containing information about the maze.
    :param folder: The output folder.
    :param name: The name of the CSV file.
    """
    completeName = join(folder, name)
    with open(completeName,"w",newline="") as pathcsv:
        csvWriter = csv.writer(pathcsv,delimiter=',')
        csvWriter.writerows(data)
Lastly, we modify the end of our script to include the new functions we created:
completeName = join(input_folder, "data.csv")
with open(completeName, 'r') as file:
    data = csvToList(file)
    validation = validateMaze(data)
    if validation[0]:
        # writeMaze(data)
        G = listToNetworkXGraph(data, display=False)
        # New functions
        startPoint, endPoint = locateStartAndEnd(data)
        shortestPath = calculatePath(G, startPoint, endPoint)
        mazeSolution(data, shortestPath)
        exportCSV(data, output_folder, "mazePath.csv")

    else:
        print(validation[1])
        exit()
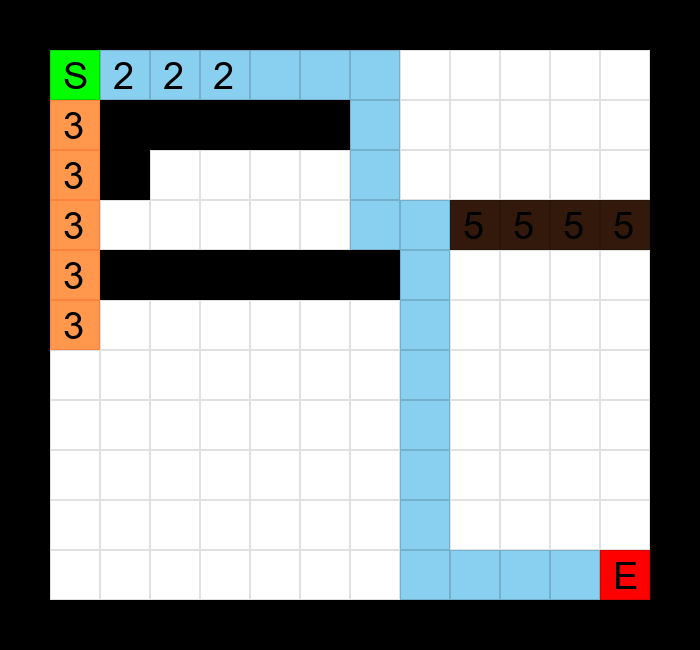
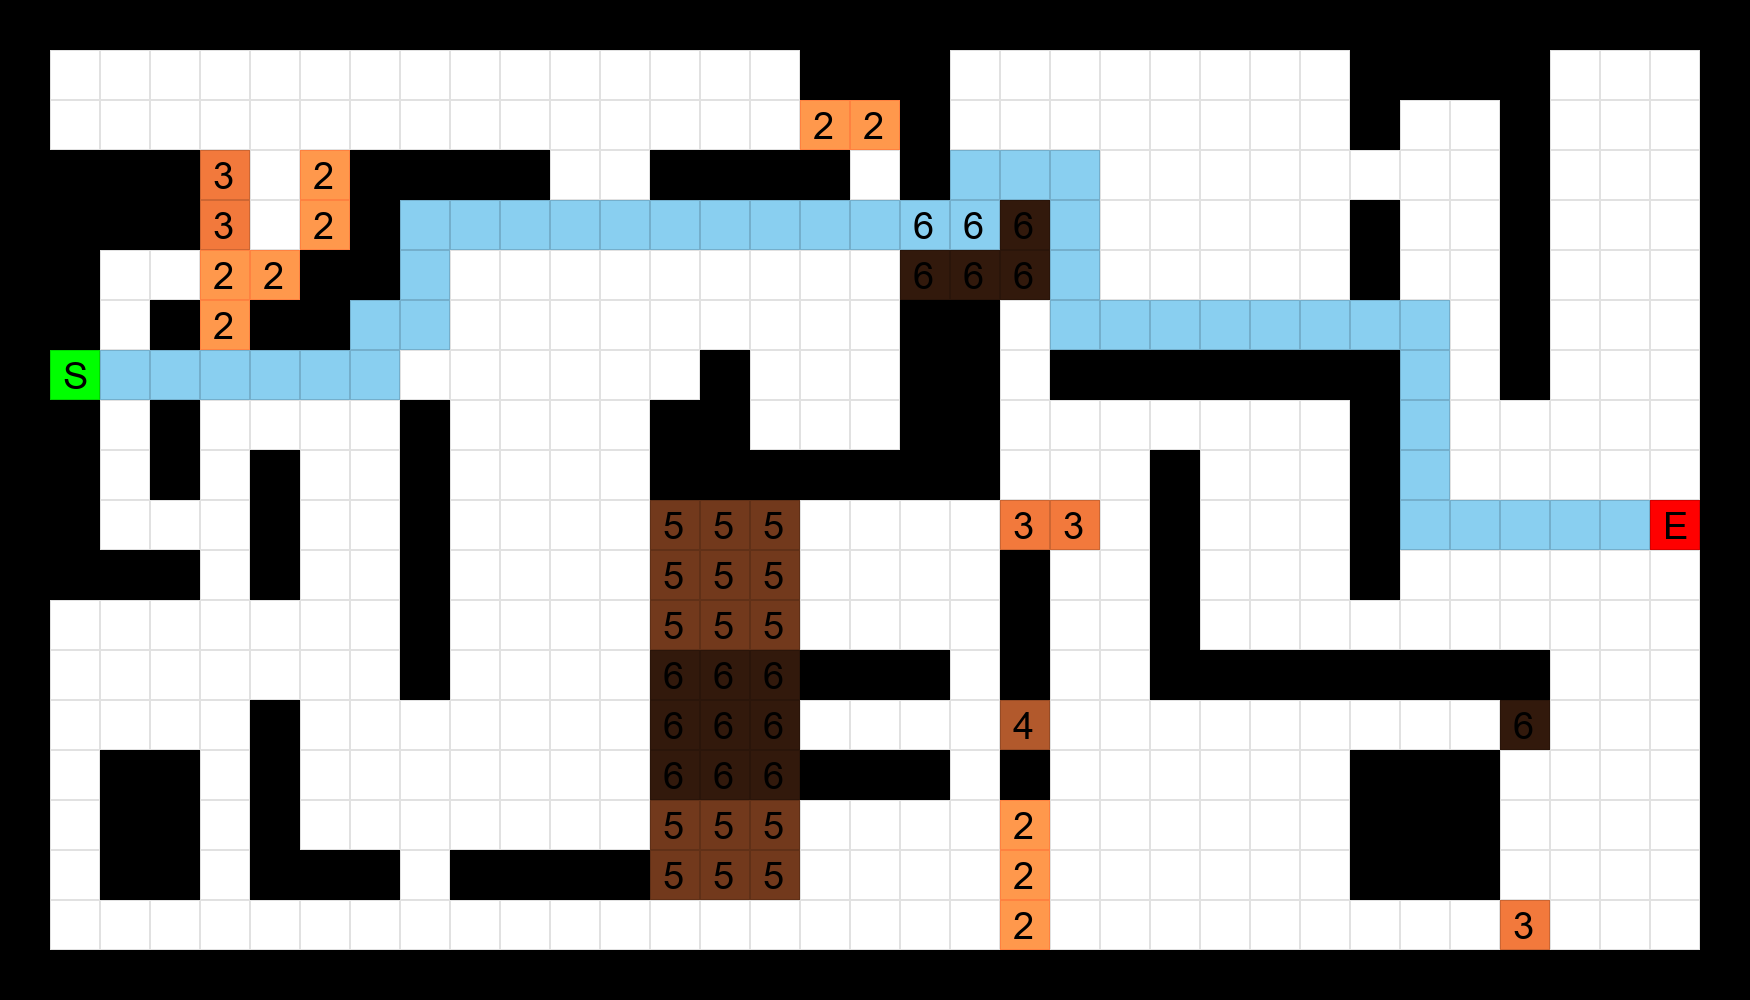
Upon running the crosscompute command and supplying a CSV maze file input, we recieve a CSV showing the entire maze with the path being shown by P.
UNavMaze Phase 2 Tutorial
Synopsis
Phase 1 of UNavMaze will consist of taking a maze CSV file as an input and then outputing a PNG file containing an image of the maze by coloring pixels.
Table of Contents
Iteration 1
Goal
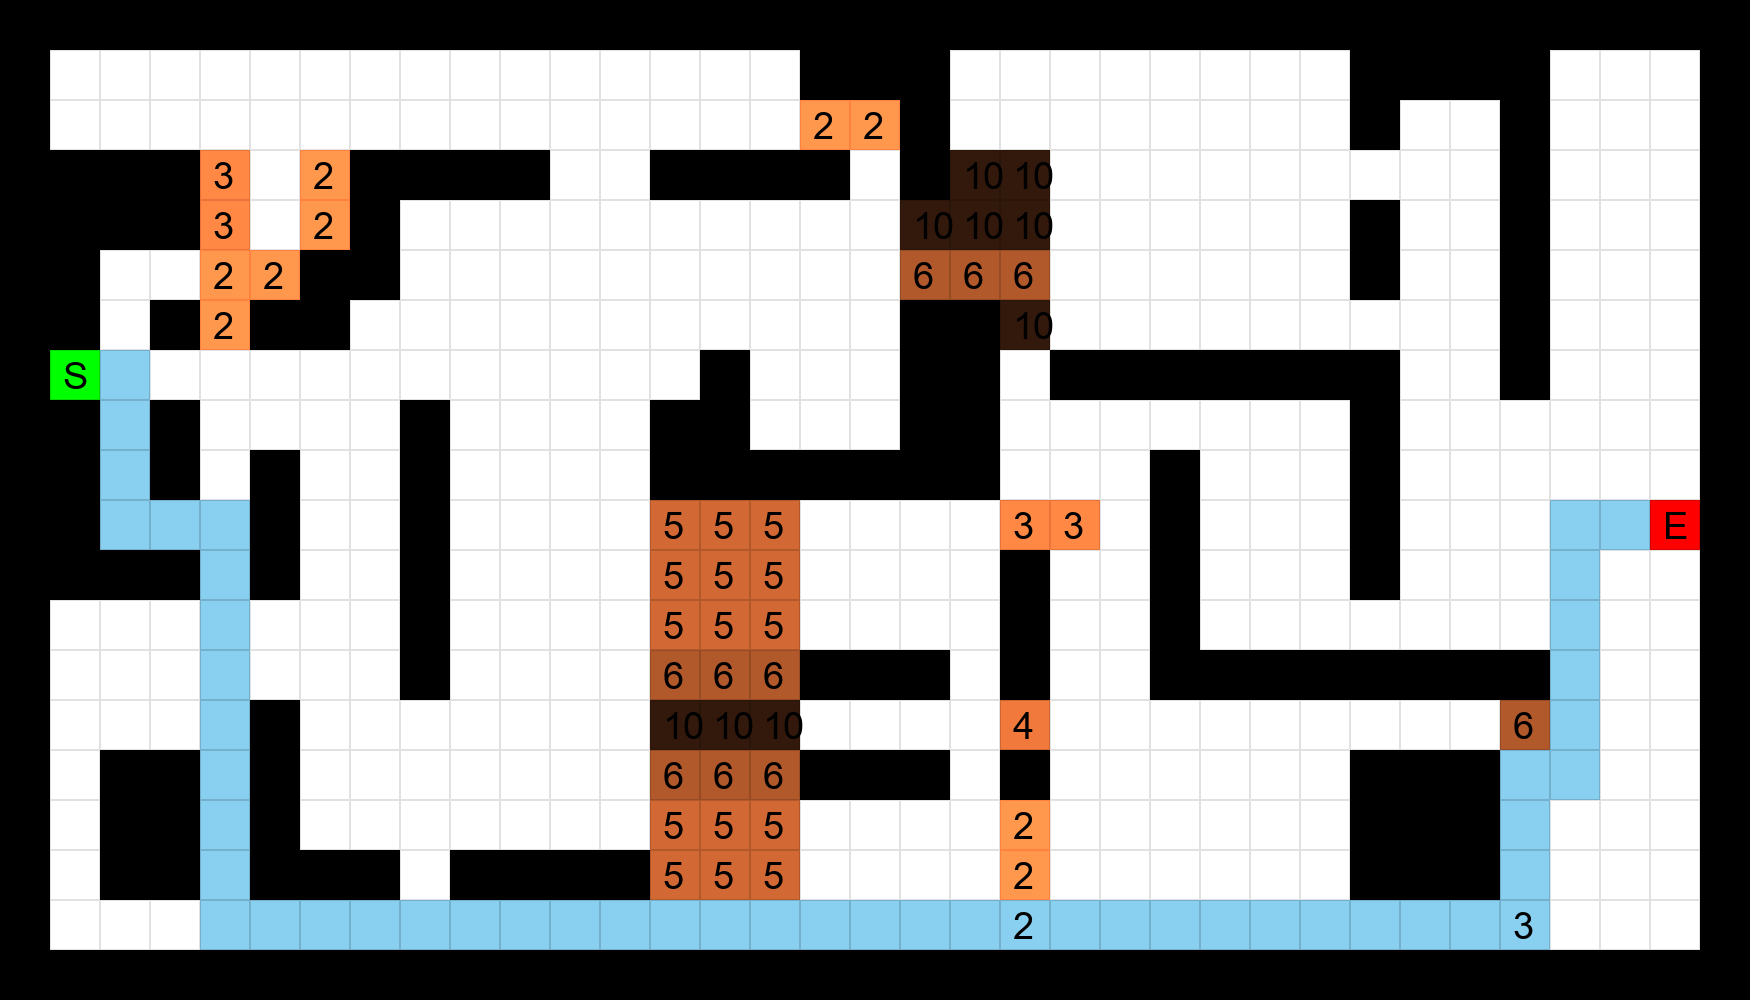
Our goal for Iteration 1 is to use the Pillow library in order to create an image of a maze by coloring in pixels.
Configure automate.yml | Reference
Edit Output Variable
The view is changed to image in order to output our image. The path will be changed to a .png
# output configuration
output:
  variables:
    - id: mazeImage
      view: image
      path: mazeImage.png
Configure Environment
Our environment also needs to include the Pillow library to be able to create the images.
environment:
  packages:
    - id: networkx[default]
      manager: pip
    - id: matplotlib==3.7.2
      manager: pip
    - id: Pillow
      manager: pip
Configure run.py | Reference
The createImage Function
This function will create an image from our data and a scale parameter; scale will determine how large the image will be scaled.
We begin by specifying the width and height of our image. We get the width from multiplying our total amount of columns by the scale. Similarly, we get height from multiplying our total amount of rows by the scale.
width = len(data[0])*scale
height = len(data)*scale
img  = Image.new(mode = "RGB", size = (width, height), color=(255,255,255)) # color(255,255,255) specifies the background to be white instead of the default (black)
Now, we iterate through our 2D list and color every entry based on what the entry is.
- Walls will be colored black
- Path will be colored blue
- Start will be colored green
- End will be colored red
- Weighted path will be colored with a darker shade of brown the higher weighed it is (compared to the min and max weights of the maze).
The weighted path will be slightly more complicated to implement.
We will color a darker shade of brown depening on how highly weighed it is relative to its maximum and minimum weights.
For example, in a maze with minimum weight of 1 and maximum weight of 100 the shade of brown for weight 50 is equivalent in color to another maze with minimum weight of 1 and maximum weight of 10 with a cell weighed as 5.
The getMinAndMax Function
In order to implement this, we first need to create a function that iterates through the entire list and returns the maximum and minimum weights of the maze:
def getMinAndMax(data):
    """
    Gets the minimum and maximum weight values from a maze.
    :param data: The 2D list to get the information from.
    """
    min = 999999999
    max = 0
    for i in range(len(data)):
        for v in range(len(data[0])):
            entry = data[i][v]
            if entry.isnumeric():
                if int(entry) > 1:
                    if int(entry) < min:
                        min = int(entry)
                    if int(entry) > max:
                        max = int(entry)
    return min,max
Calculate RGB Value of Brown Based on Interval
Using the min and max values obtained from this function, we need to normalize the range so that its between 0 and 1.
We use the following equation to implement this:
(x-min)/(max-min)
x being the weight of the cell currently being inspected.
We multiply the normalized value by 255 to get the number in RGB color range.
255*((x-min)/(max-min))
Our color needs to be darker the higher the value is (it needs to be closer to black:(0,0,0)). This means we need a lower RGB value for a highly weighed number.
By subtracting 255 from our number we can reverse the effect to get a darker shade.
255-(255*((x-min)/(max-min)))
Shades of brown can be created in the following way:
red = x, green = x // 2, blue = green // 2
One problem to account for is that the min value will map to (0,0,0) (black) using this equation. To circumvent this, we add 50 to the overall equation to get a light shade of brown instead of getting black.
50+(255-(255*((x-min)/(max-min))))
Now we just iterate through the entire 2D list and substitute x for data[i][v] to account for the current entry.
for i in range(len(data)):
        for v in range(len(data[0])):
            if len(data[i][v]) > 0:
                if data[i][v].isnumeric():
                    if int(data[i][v]) > 1: # color weighted path brown
                        red = 50+(255-(255 * (int(data[i][v])-min) // (max-min)))
                        green = red // 2
                        blue = green // 2
                        putPixel(img, v, i, (red,green,blue), scale)
                if data[i][v].lower() == "w": # if wall, color black
                    putPixel(img, v, i, (0,0,0), scale)
                if (data[i][v].lower())[-1] == "p": # if path, color blue
                    putPixel(img, v, i, (137, 207, 240), scale)
                if data[i][v].lower() == "s": # if start, color green
                    putPixel(img, v, i, (0,255,0), scale)
                if data[i][v].lower() == "e": # if end, color red
                    putPixel(img, v, i, (255,0,0), scale)
The putPixel Function
We will now define the putPixel function being referenced here.
putPixel will color in a scale*scale box depending on the color. For example, if the scale is 5 and we color black, it will be a 5*5 black square.
def putPixel(img, row, col, color, scale):
    """
    Color a square of pixels with a given color.
    :param img: The image to be colored.
    :param row: Row value.
    :param col: Col value.
    :param color (3-tuple): An rgb color value.
    """
    for j in range(scale):
        for k in range(scale):
            xPos = (row*scale)+(j)
            yPos = (col*scale)+(k)
            img.putpixel((xPos,yPos), color)
The labelWeights Function
Now, we label the weights for every weighted cell by using a font that is also scaled so that it fits in the boxes.
I1 = ImageDraw.Draw(img)
    font = ImageFont.truetype("arial.ttf",scale*.75) # arial must be installed on system
Now we iterate through every entry and label all of the weights. We position the numbers in the center of every box based on scale.
def labelWeights(img, data, scale):
    I1 = ImageDraw.Draw(img)
    font = ImageFont.truetype("arial.ttf",scale*.75) # arial must be installed on system
    for i in range(len(data)):
        for v in range(len(data[0])):
            entry = data[i][v]
            if len(entry) > 1:
                if entry[-1] == "P":
                    entry = entry[:-1] # remove the last character (P) so we can label only the numerical weight
                I1.text((v*scale+scale*.25,i*scale+scale*.1),entry,font=font,fill=(0,0,0))
            elif entry.isnumeric():
                if int(entry) > 1: # if weighed cell
                    I1.text((v*scale+scale*.25,i*scale+scale*.1),entry,font=font,fill=(0,0,0))
            elif entry.lower() == "s": # if start
                I1.text((v*scale+scale*.25,i*scale+scale*.1),entry,font=font,fill=(0,0,0))
            elif entry.lower() == "e": # if end
                I1.text((v*scale+scale*.25,i*scale+scale*.1),entry,font=font,fill=(0,0,0))
Now we modify the end of our run.py to include the createImage function:
completeName = join(input_folder, "data.csv")
with open(completeName, 'r') as file:
    data = csvToList(file)
    validation = validateMaze(data)
    if validation[0]:
        # writeMaze(data)
        G = listToNetworkXGraph(data, display=False)
        startPoint, endPoint = locateStartAndEnd(data)
        shortestPath = calculatePath(G, startPoint, endPoint)
        mazeSolution(data, shortestPath)
        createImage(data, 15) # <- Added function
    else:
        print(validation[1])
        exit()
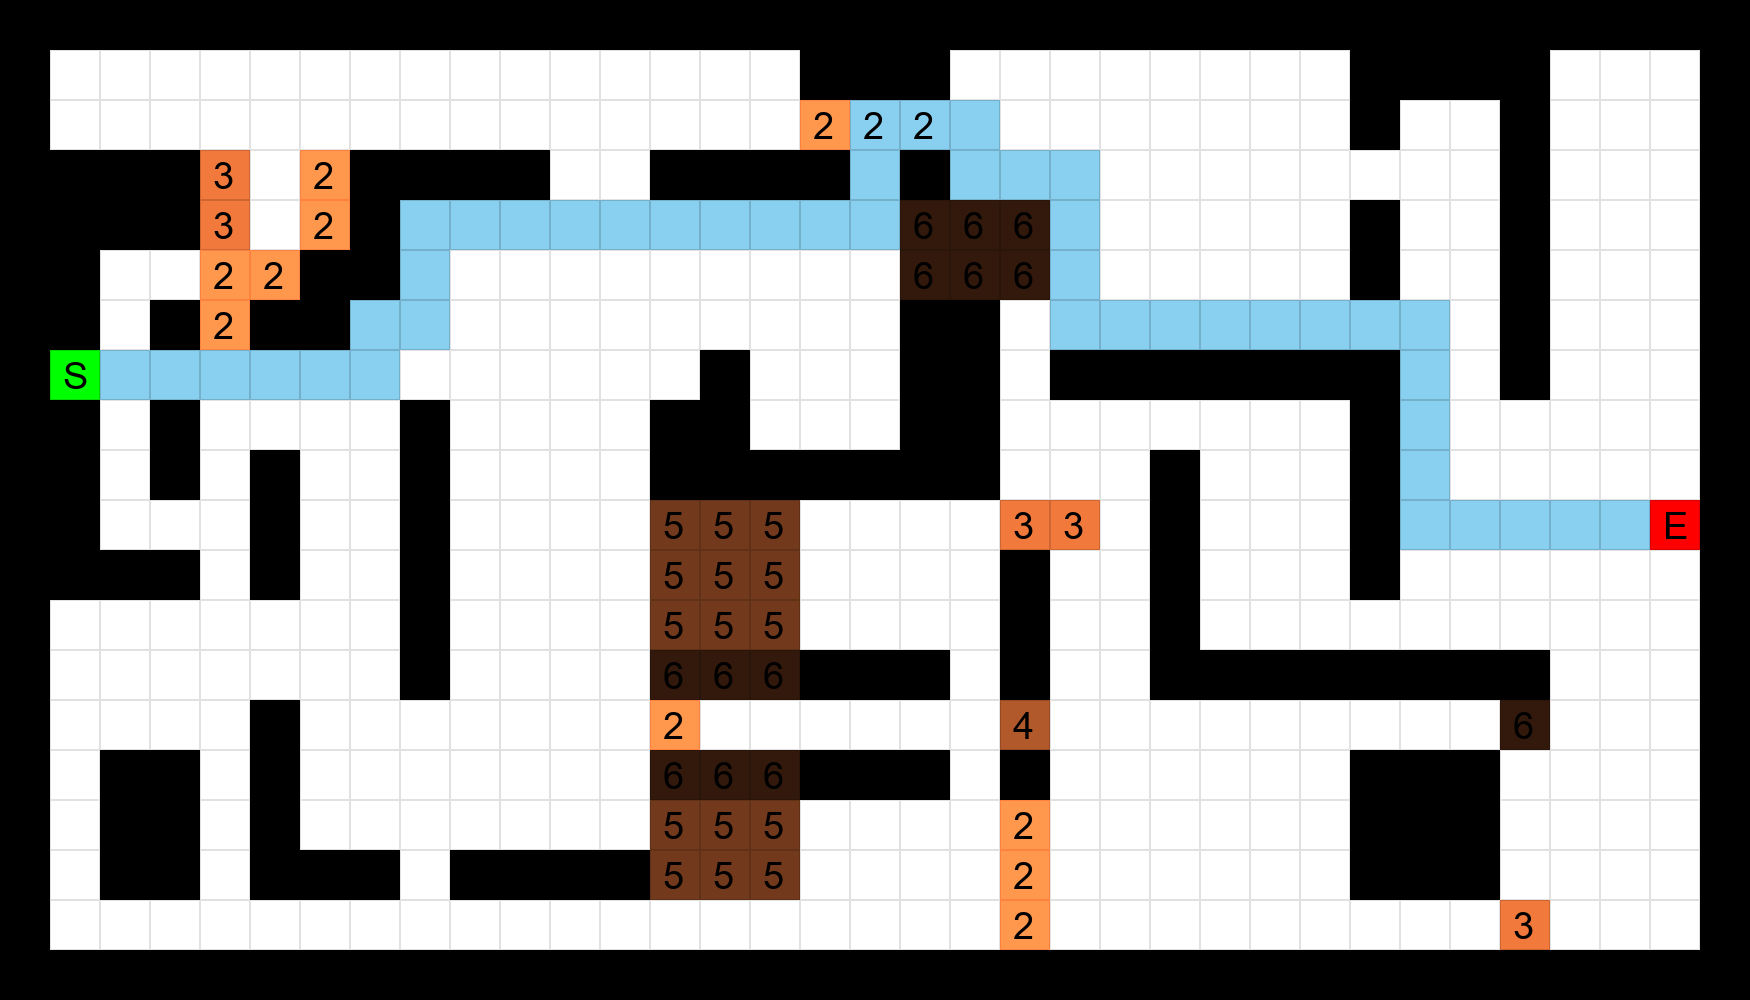
Upon running the crosscompute command, we can now input a CSV maze and a maze image will be outputted.
Iteration 2
Goal
Our goal in Iteration 2 is to color the outlines of the squares so we can discern between each cell. Additionally, we will scale each maze so that larger mazes are scaled smaller, and smaller mazes are scaled larger, so overall they will cover approximately the same amount of space on the screen.
Configure run.py | Reference
Color Outlines of Squares
In order to discern between each box, we now color the outlines of every box darker than it’s original color.
With the following line, we can determine the outline of every square:
if j == 0 or k == 0 or j == scale-1 or k == scale-1:
In other words, if the row is the minimum number, or if the row is the maximum number, or if the column is the minimum number, or if the column is the maximum number; if any of those cases are true, then the position is an outline of the square.
We adjust the putPixel function accordingly:
def putPixel(img, row, col, color, scale):
    """
    Color a square of pixels with a given color.
    :param img: The image to be colored.
    :param row: Row value.
    :param col: Col value.
    :param color (3-tuple): An rgb color value.
    """
    for j in range(scale):
        for k in range(scale):
            xPos = (row*scale)+(j)
            yPos = (col*scale)+(k)
            if j == 0 or k == 0 or j == scale-1 or k == scale-1: # check to see if we are at an outline pixel
                if color == (255,255,255): # if white, we color outline with gray instead (empty cells)
                    img.putpixel((xPos,yPos), (225,225,225))
                else: # color darker shade of color to discern the outline
                    img.putpixel((xPos,yPos), (int(color[0]*.85),int(color[1]*.85),int(color[2]*.85)))
            else: # if we are not on at an outline pixel, color with normal color
                img.putpixel((xPos,yPos), color)
Adjust Scale Depending on Size
We adjust scale automatically depending on size so that large mazes are scaled down to fit the entire screen, and small mazes and scaled up to increase resolution as much as possible.
To do this, we first determine a maximum scale that the smallest maze would be able to scale up to. For this application, 50 will be used as the maximum. The following equation will be used to determine scale:
scale = maxScale - (maxScale * (mazeMax//maxScale))
This equation ensures that larger mazes are scaled down, and smaller mazes are scaled up. Now we implement this equation into a function:
def determineScale(data):
    mazeMin,mazeMax = getMinAndMax(data)
    maxScale = 50
    scale = maxScale - (maxScale * (mazeMax//maxScale))
    return scale
Now we edit the end of run.py to include the new functions:
completeName = join(input_folder, "data.csv")
with open(completeName, 'r') as file:
    data = csvToList(file)
    validation = validateMaze(data)
    if validation[0]:
        # writeMaze(data)
        G = listToNetworkXGraph(data, display=False)
        startPoint, endPoint = locateStartAndEnd(data)
        shortestPath = calculatePath(G, startPoint, endPoint)
        mazeSolution(data, shortestPath)
        scale = determineScale(data) # <- Added function
        createImage(data, scale)
    else:
        print(validation[1])
        exit()
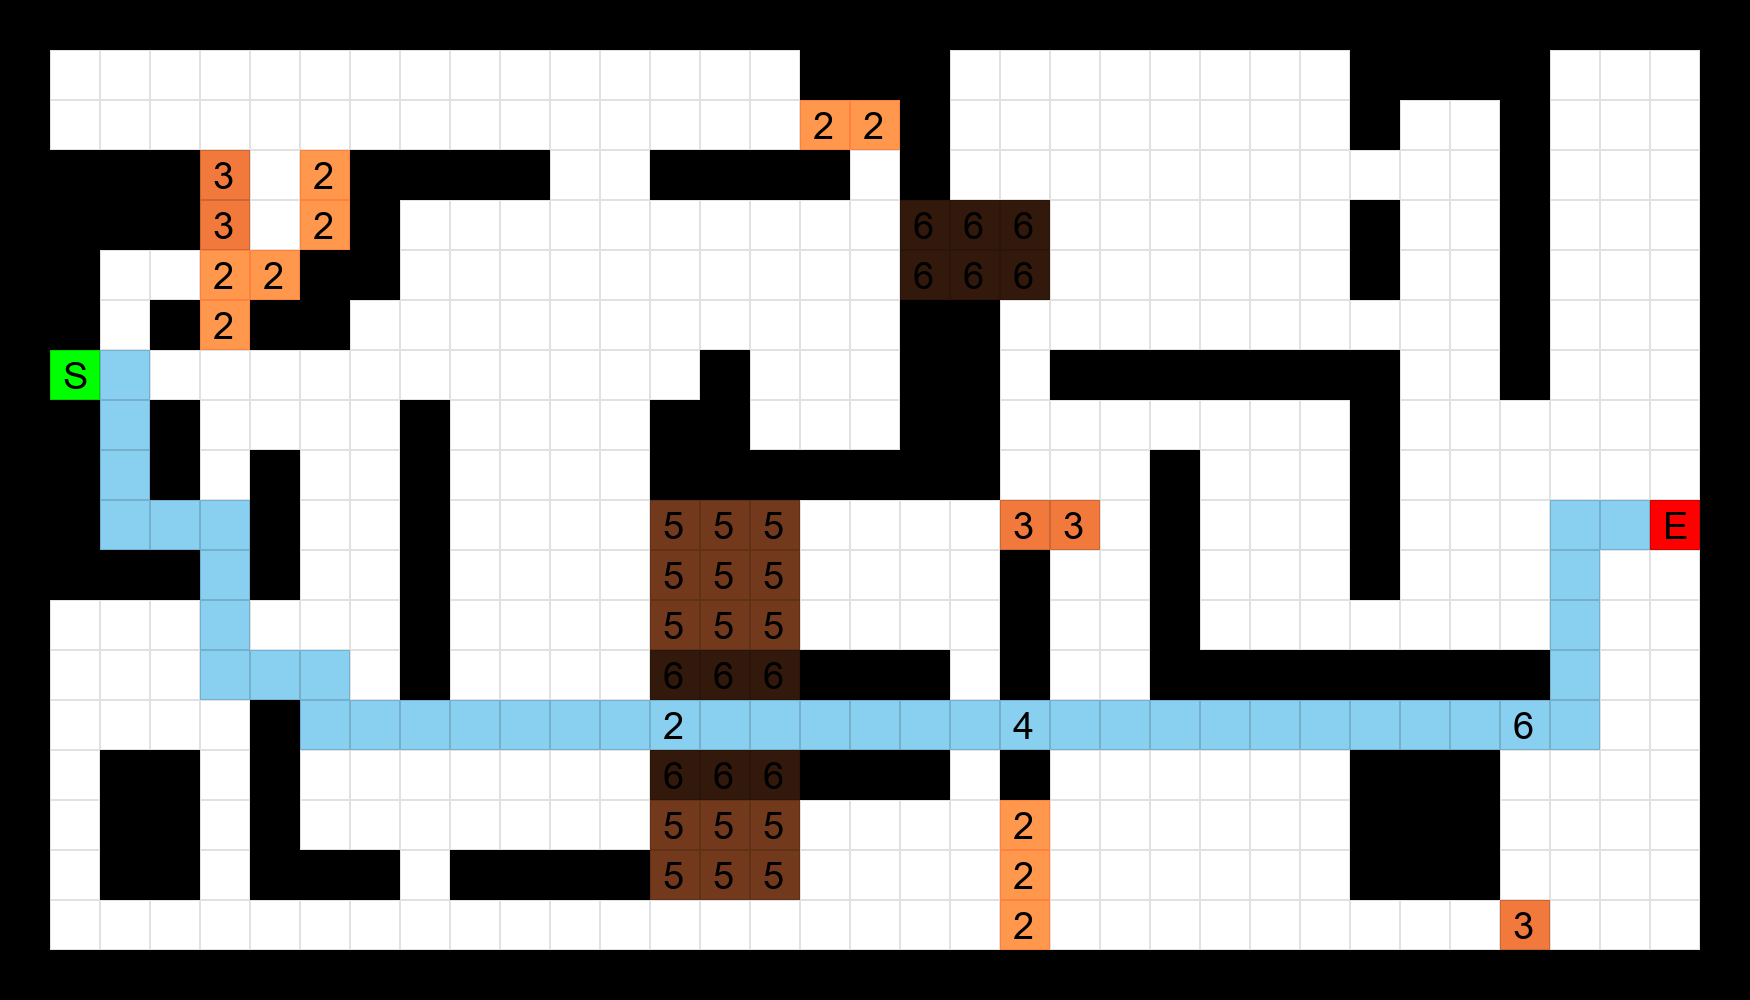
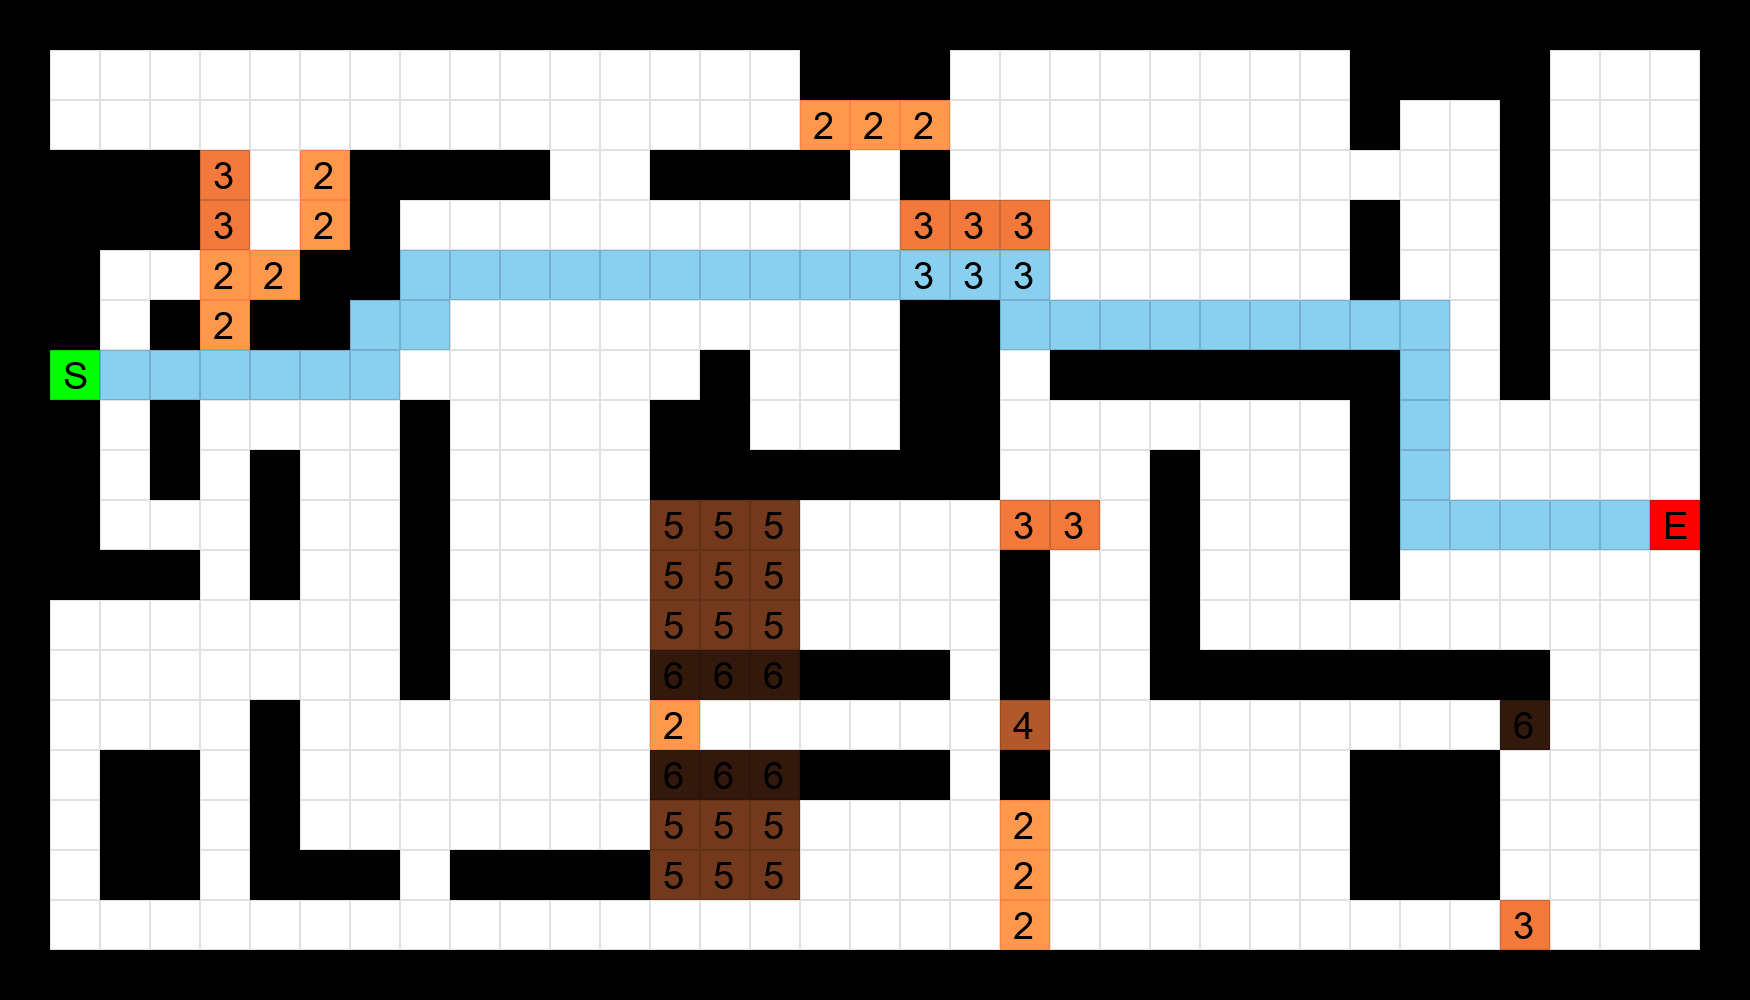
Upon running the crosscompute command, we can now input any size CSV maze file and it will output an automatically scaled PNG maze image.