This tool will help the MTA target certain subway stations to help prevent significant damage during severe coastal storms. As a result, infrastructures could be installed to handle flooding in the stations at risk.
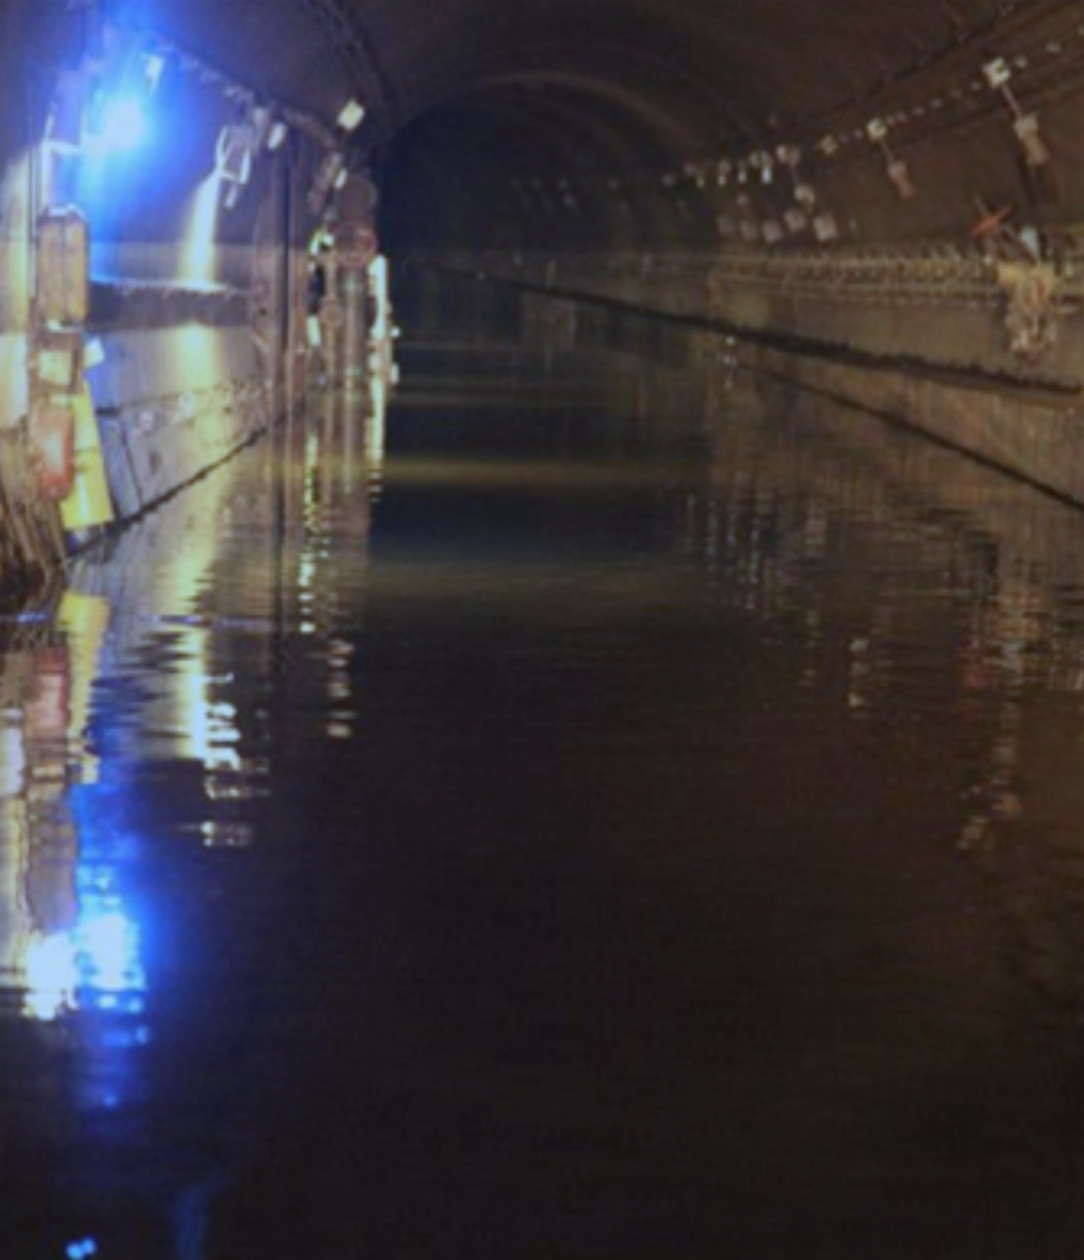
Here is a photograph of a flooded subway tunnel from Hurricane Sandy:
Input:
<neighborhood name, state> OR csv file of neighborhood + state (1 or more lines)
Given neighborhood name + state:
- Storm inundation areas dataset: https://data.cityofnewyork.us/Public-Safety/Hurricane-Inundation-Zones-NW/tpix-uwie
- Subway stations dataset: https://data.cityofnewyork.us/Transportation/Subway-Stations/arq3-7z49
- Calculate distance of stations from the storm inundation areas and the lower the distance, the higher the risk.
Result Properties:
- Zoom in to neighborhood(s) on map and plot the subway stations that are prone to flooding, color-coded by risk rate (high risk=red, moderate risk=yellow).
Example:

- Be able to download map as CSV (station_name, neighborhood_name, flood_risk, storm_inundation_distance)